San Diego Region - IWTP 10 November 1999 Presentation
Below is the list of overheads used by the International Boundary and Water Commission in presenting the International Wastewater Treatment Plant Ocean Monitoring Data Status Report to the Regional Board on November 10, 1999.
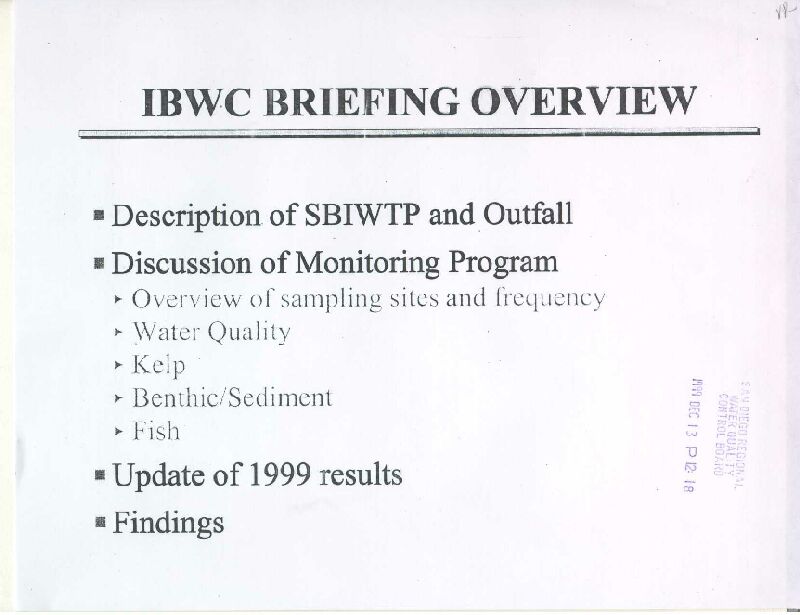
01 - IBWC
Briefing Overview
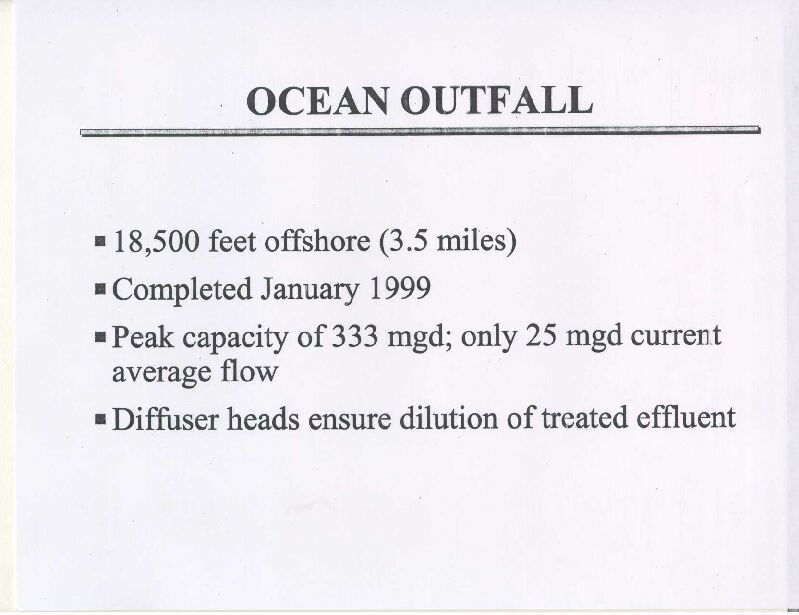
02 - Ocean
Outfall
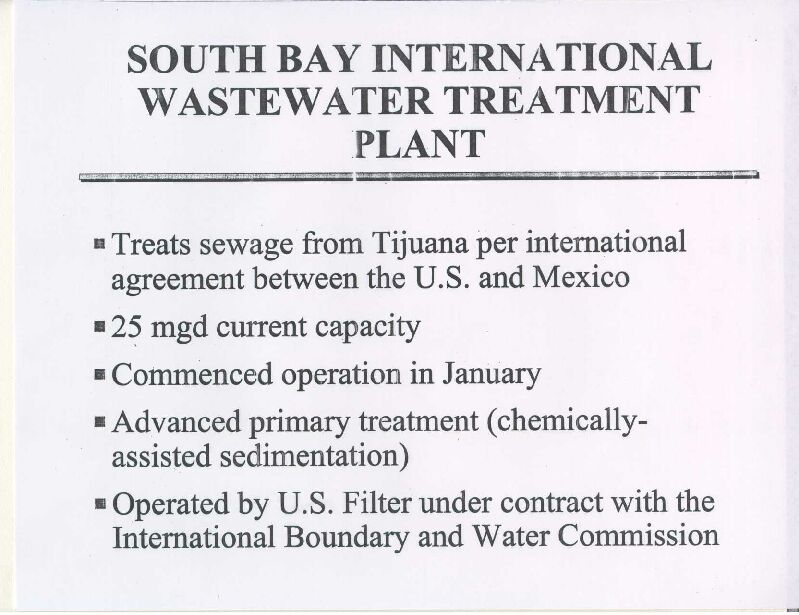
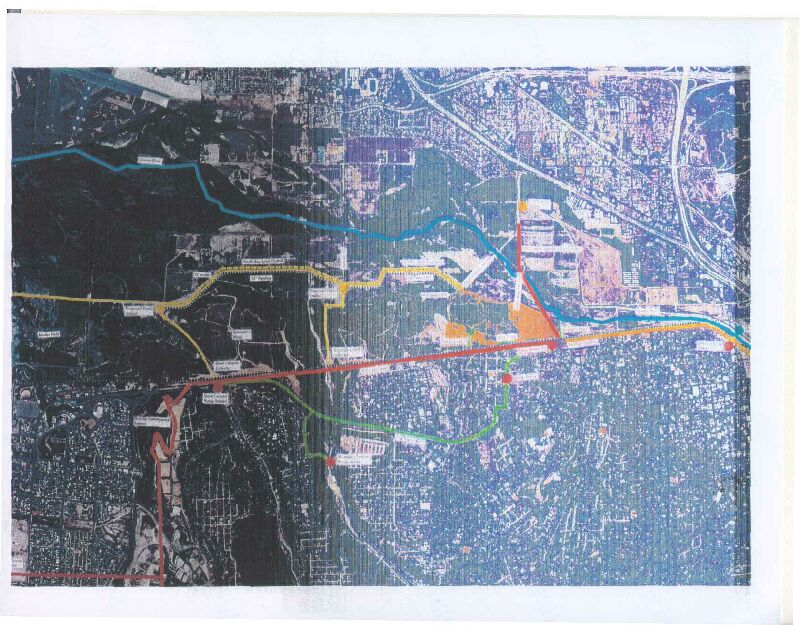
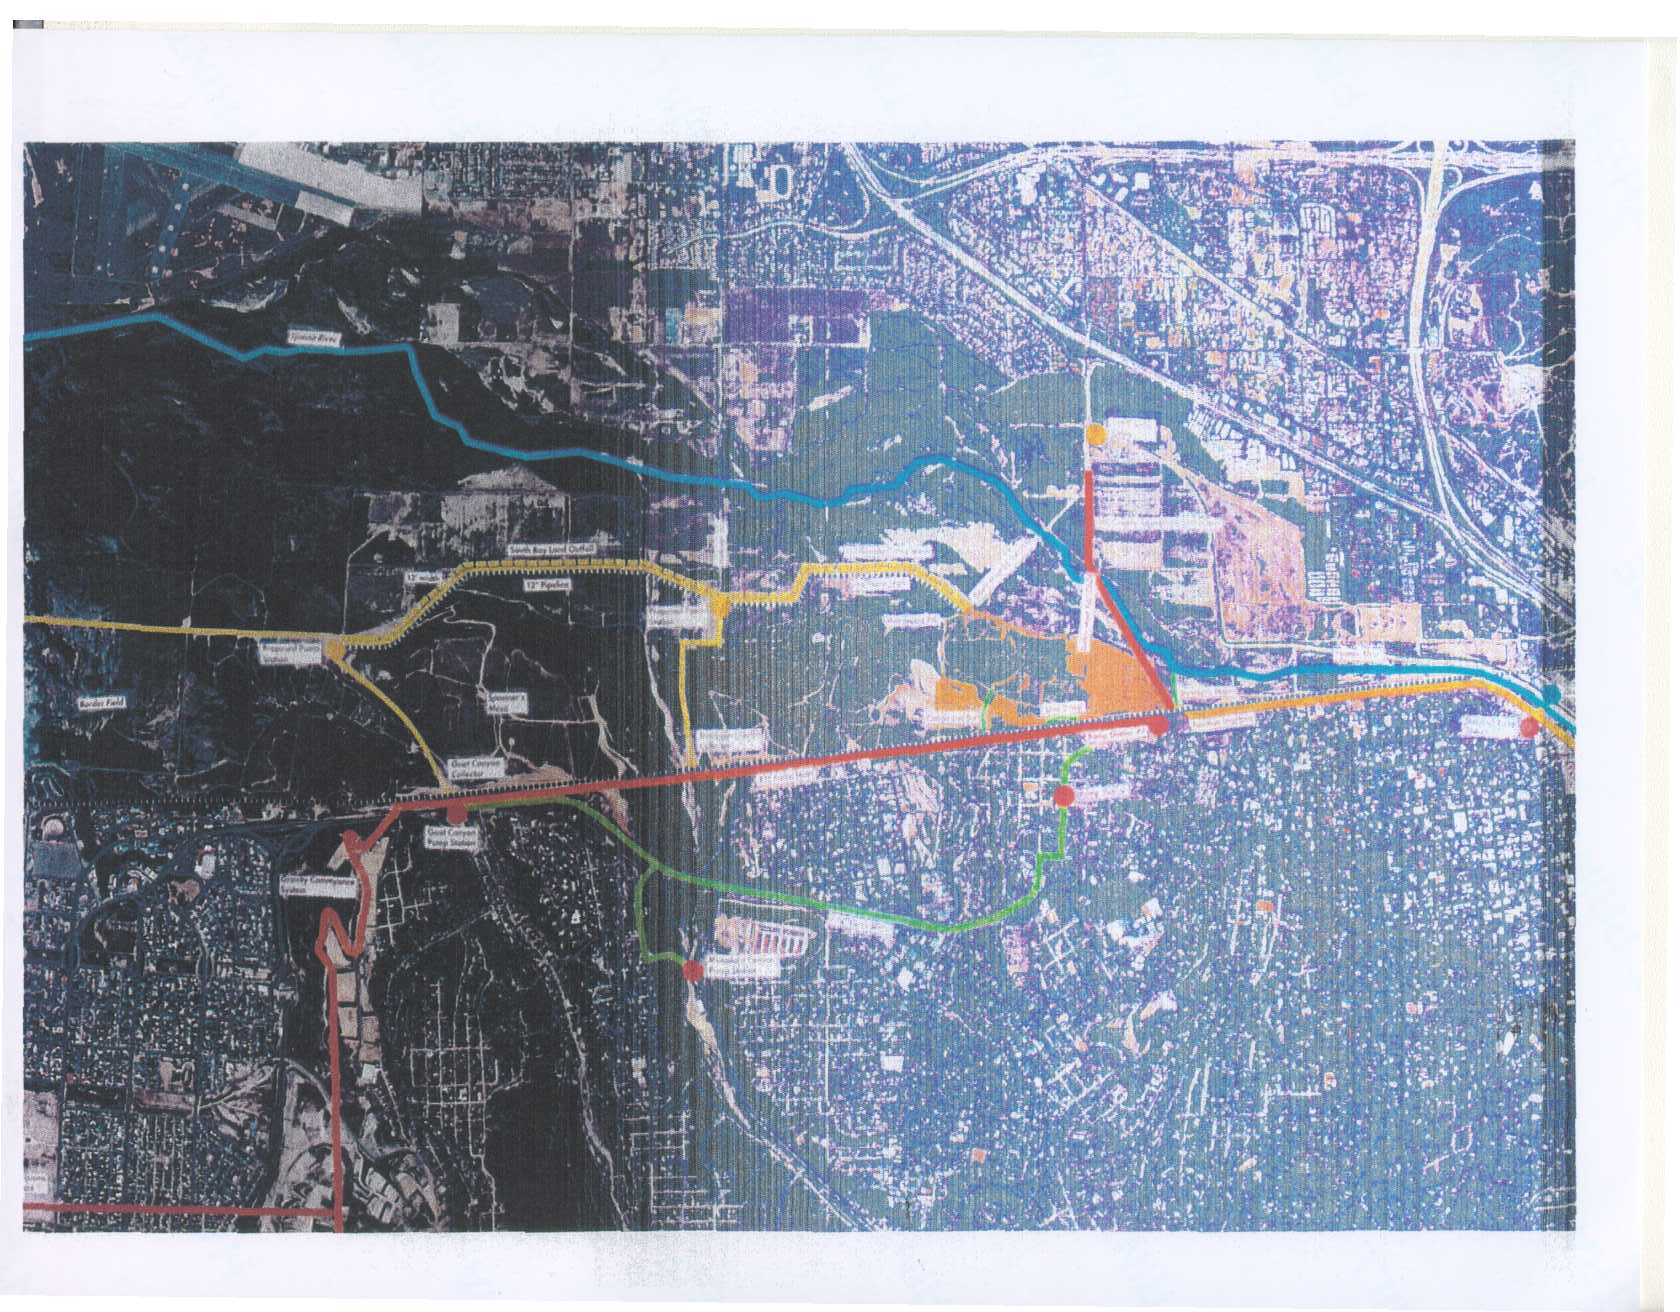
03 - Southbay
International Wastewater Treatment Plant
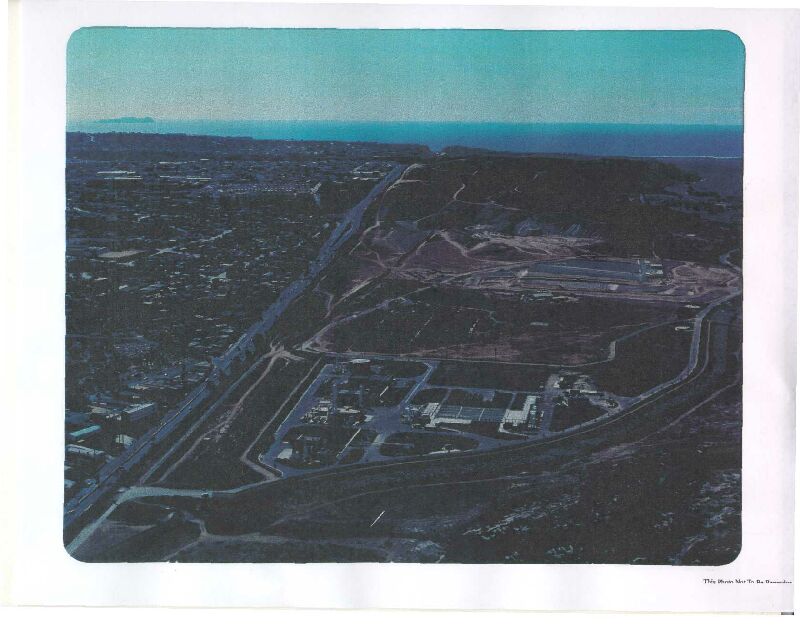
04 - IWTP
Site Photo (higher
resolution)
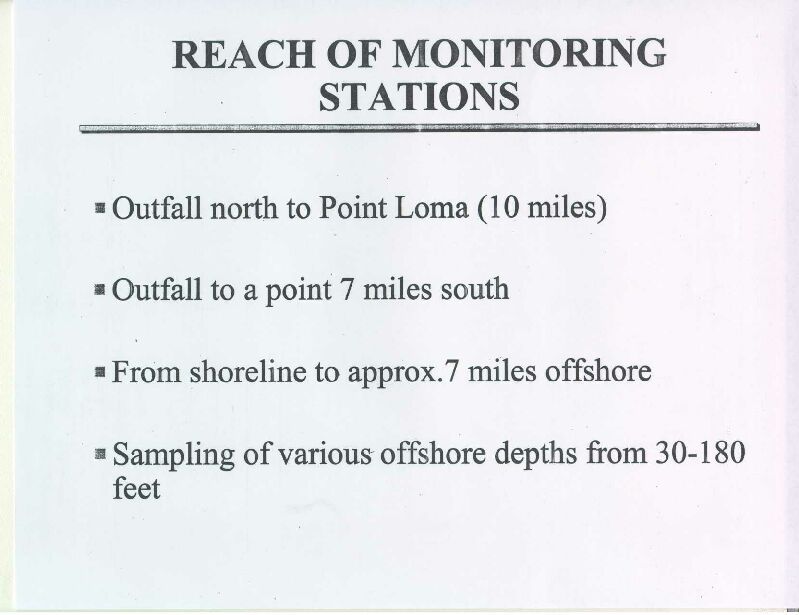
05 - Reach
of Monitoring Stations
06 - Collections
Photo (higher
resolution)
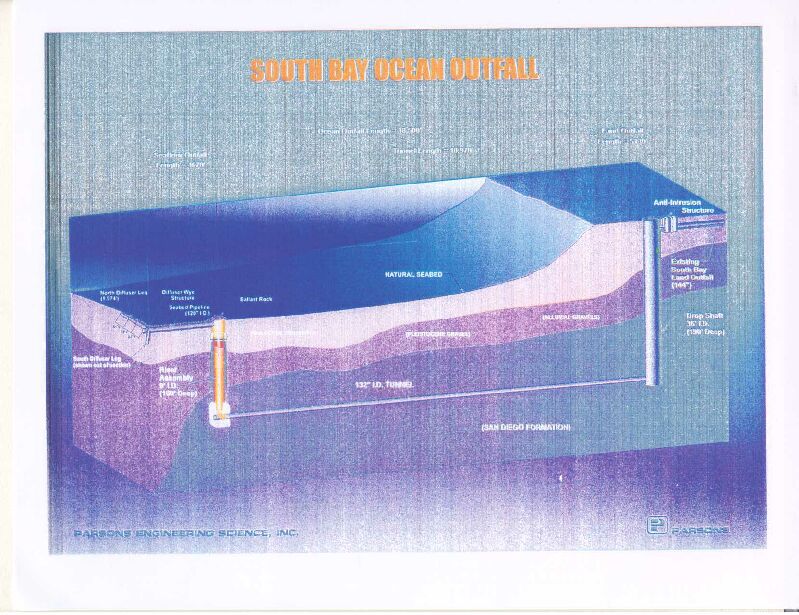
07 - Southbay Ocean Outfall Diagram (higher
resolution)
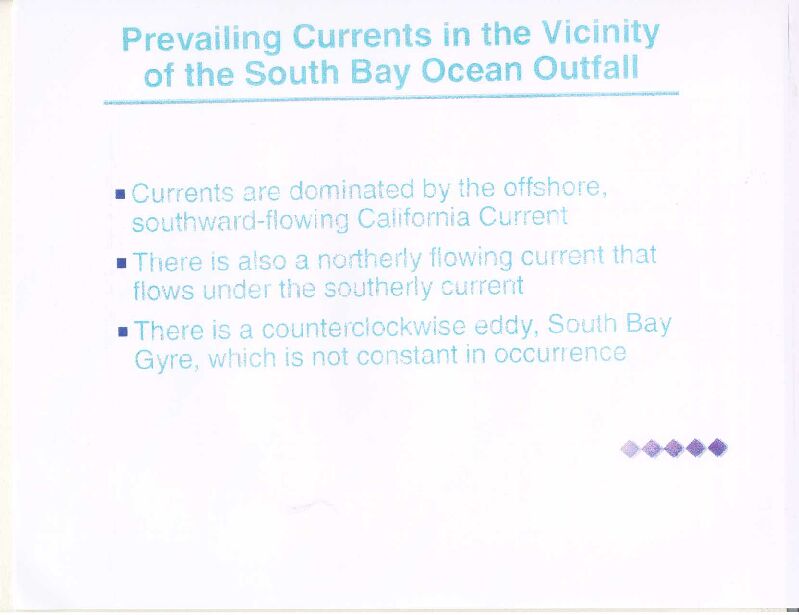
08 - Prevailing
Currents in the Vicinity of the SBOO
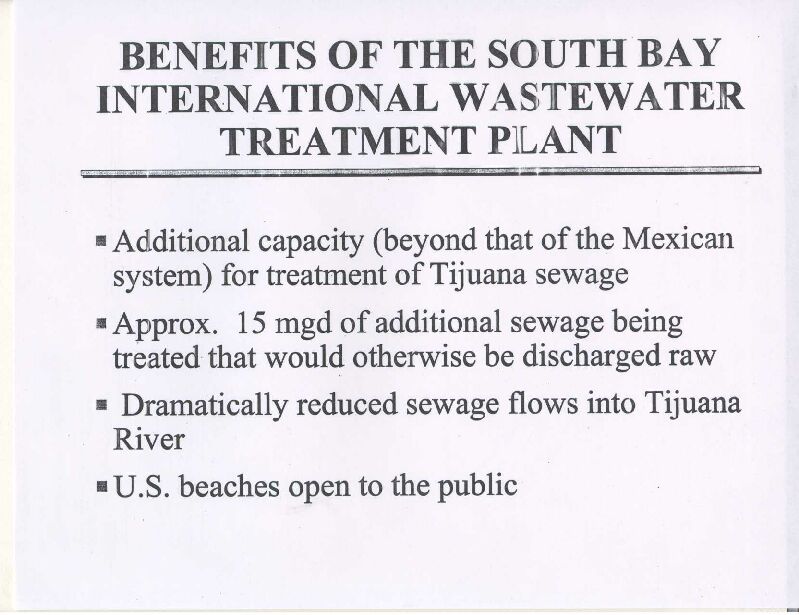
09 - Benefits
of the Southbay IWTP
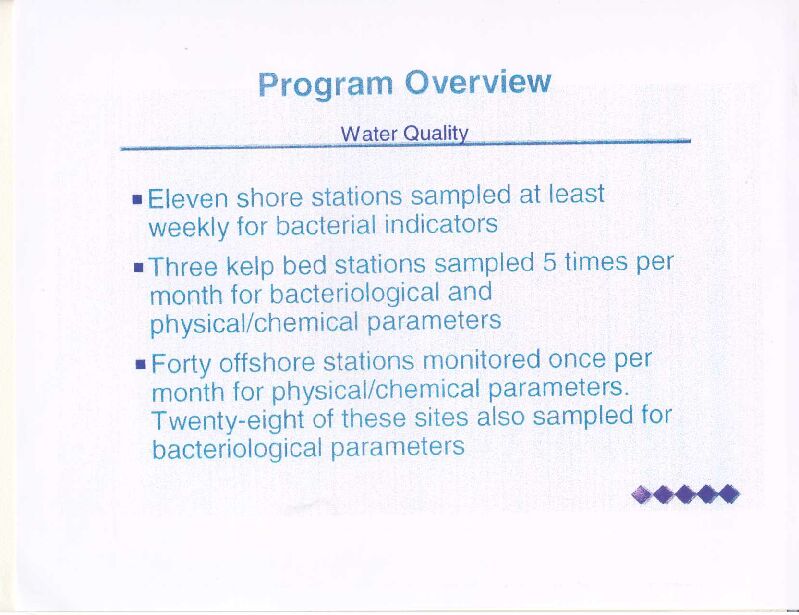
10 - Program
Overview Water Quality
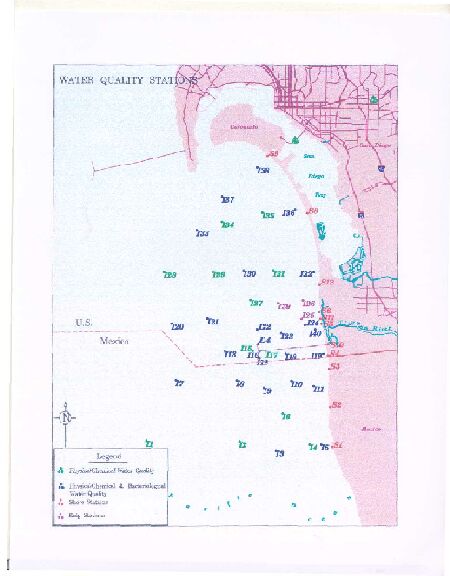
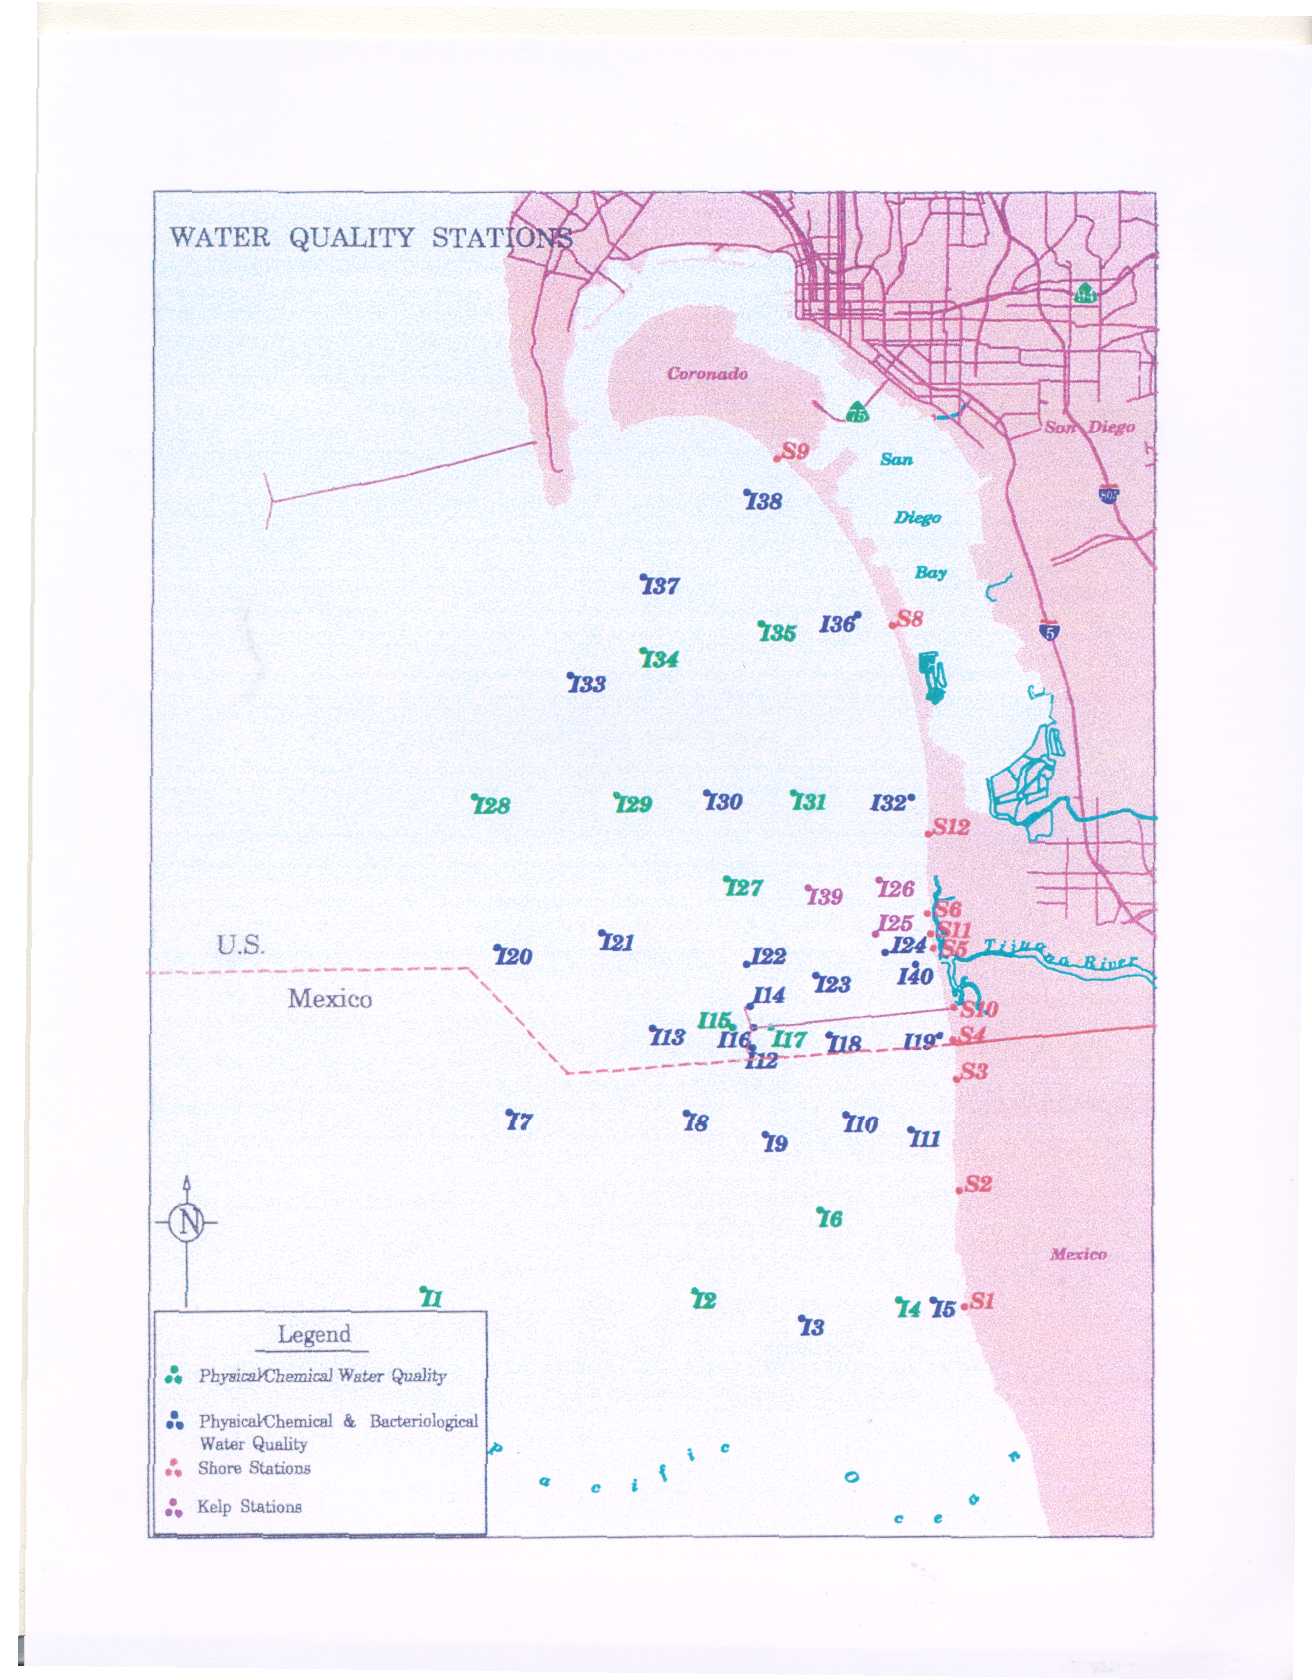
11 - Water
Quality Stations (higher resolution)
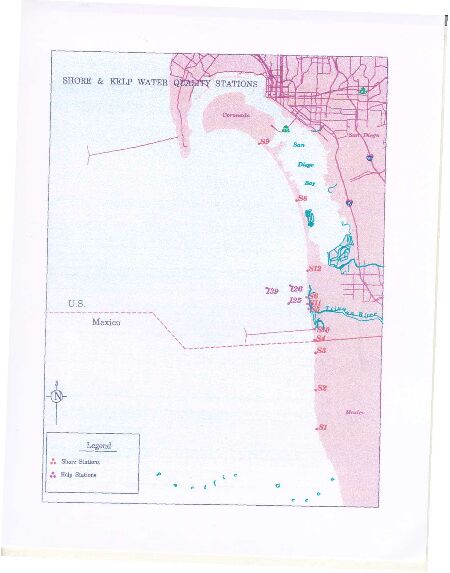
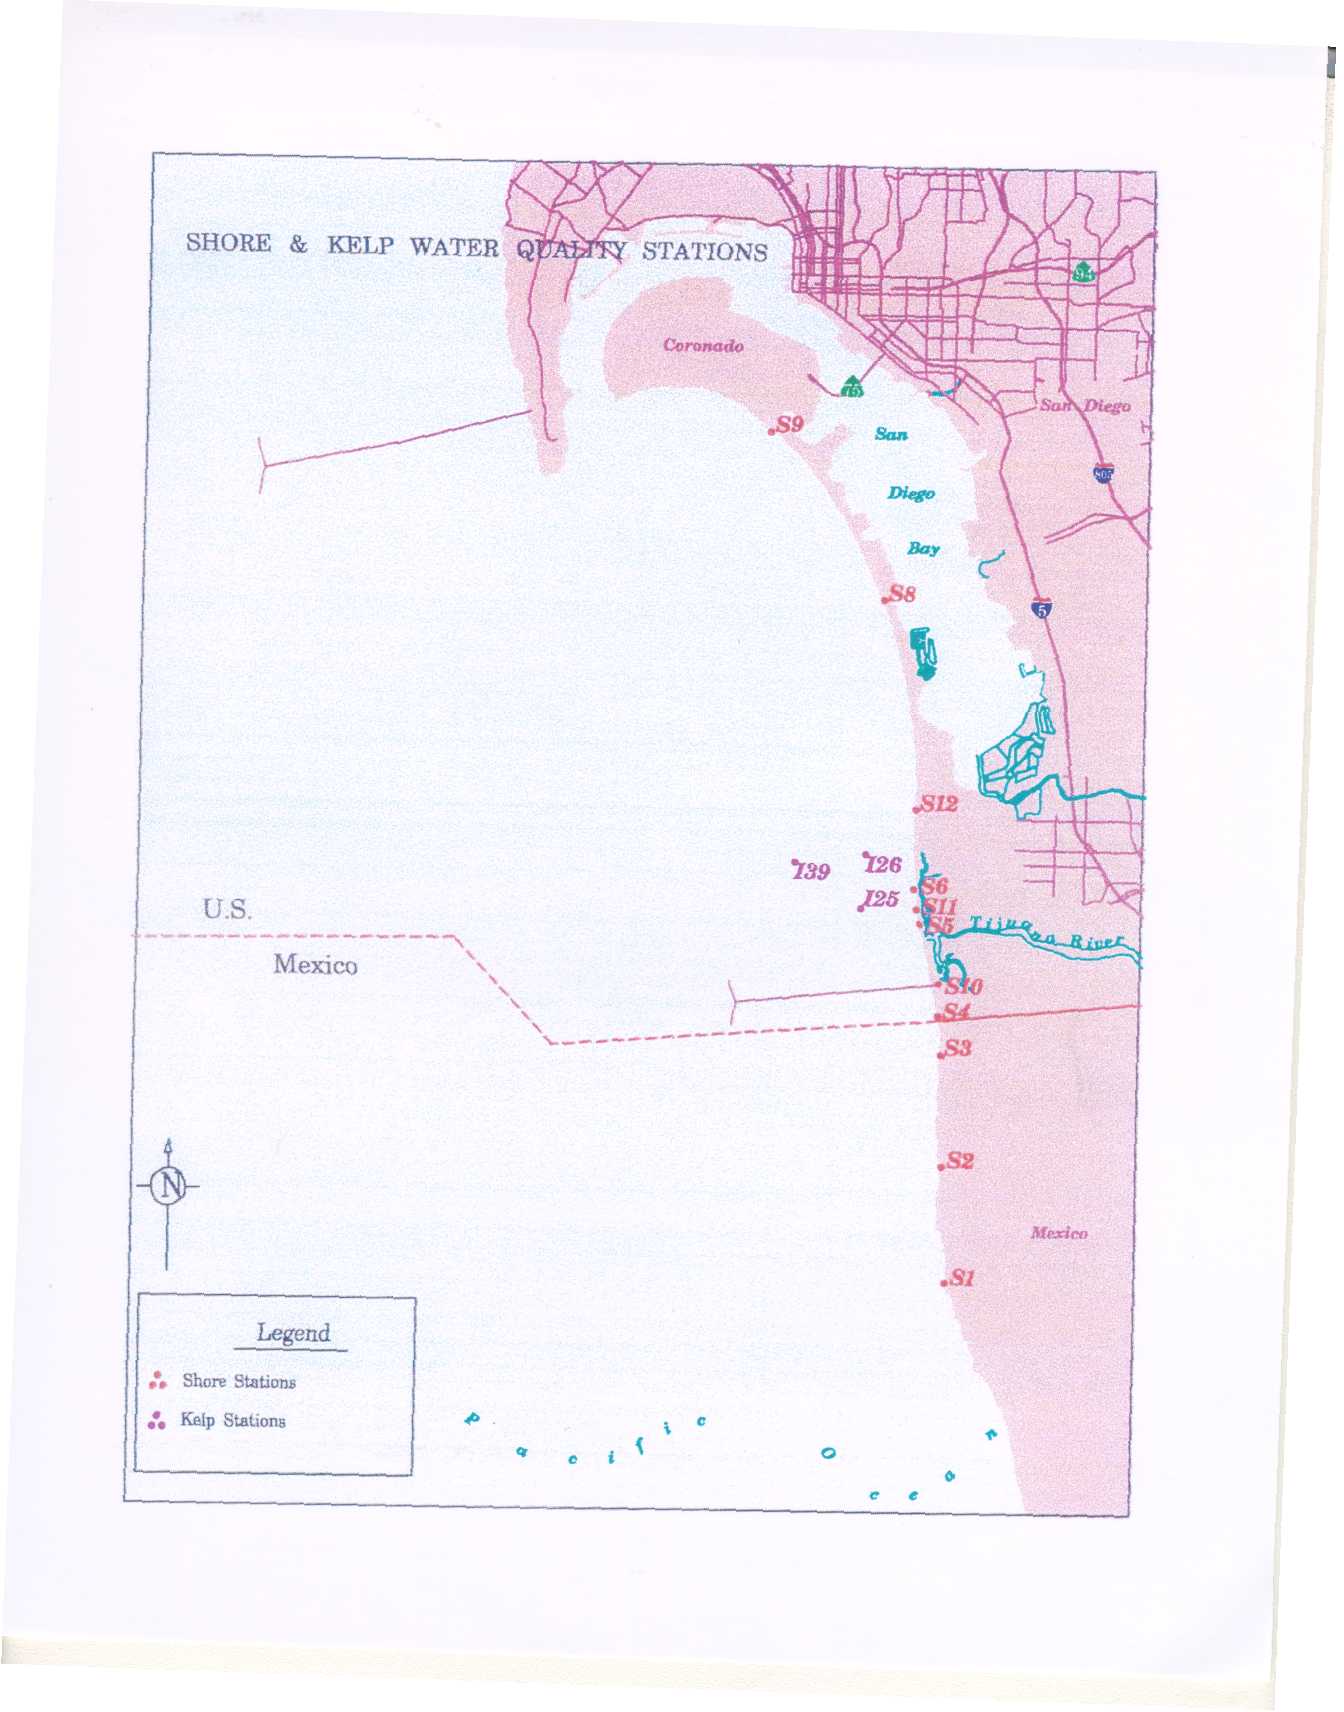
12 - Shore
& Kelp Water Quality Stations (higher
resolution)
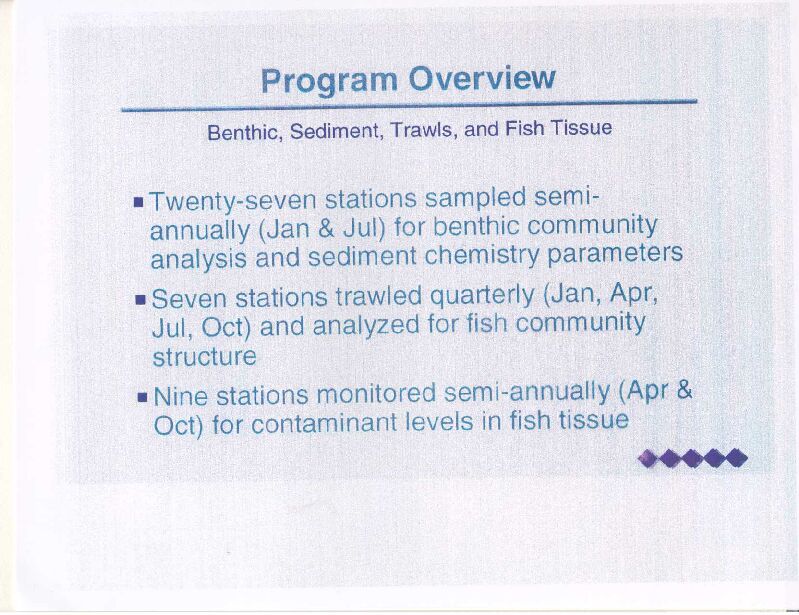
13 - Program
Overview Benthic, Sediment, Trawls, and Fish Tissue
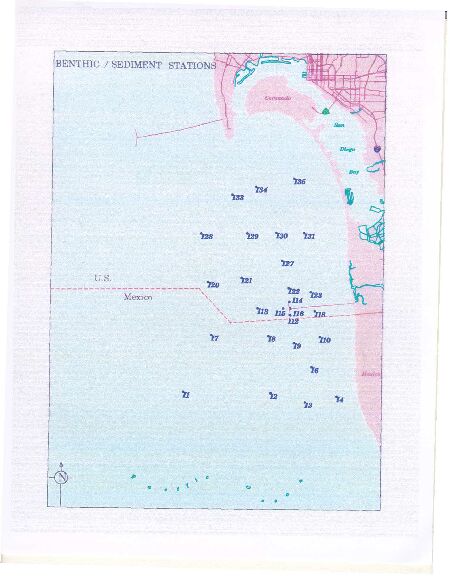
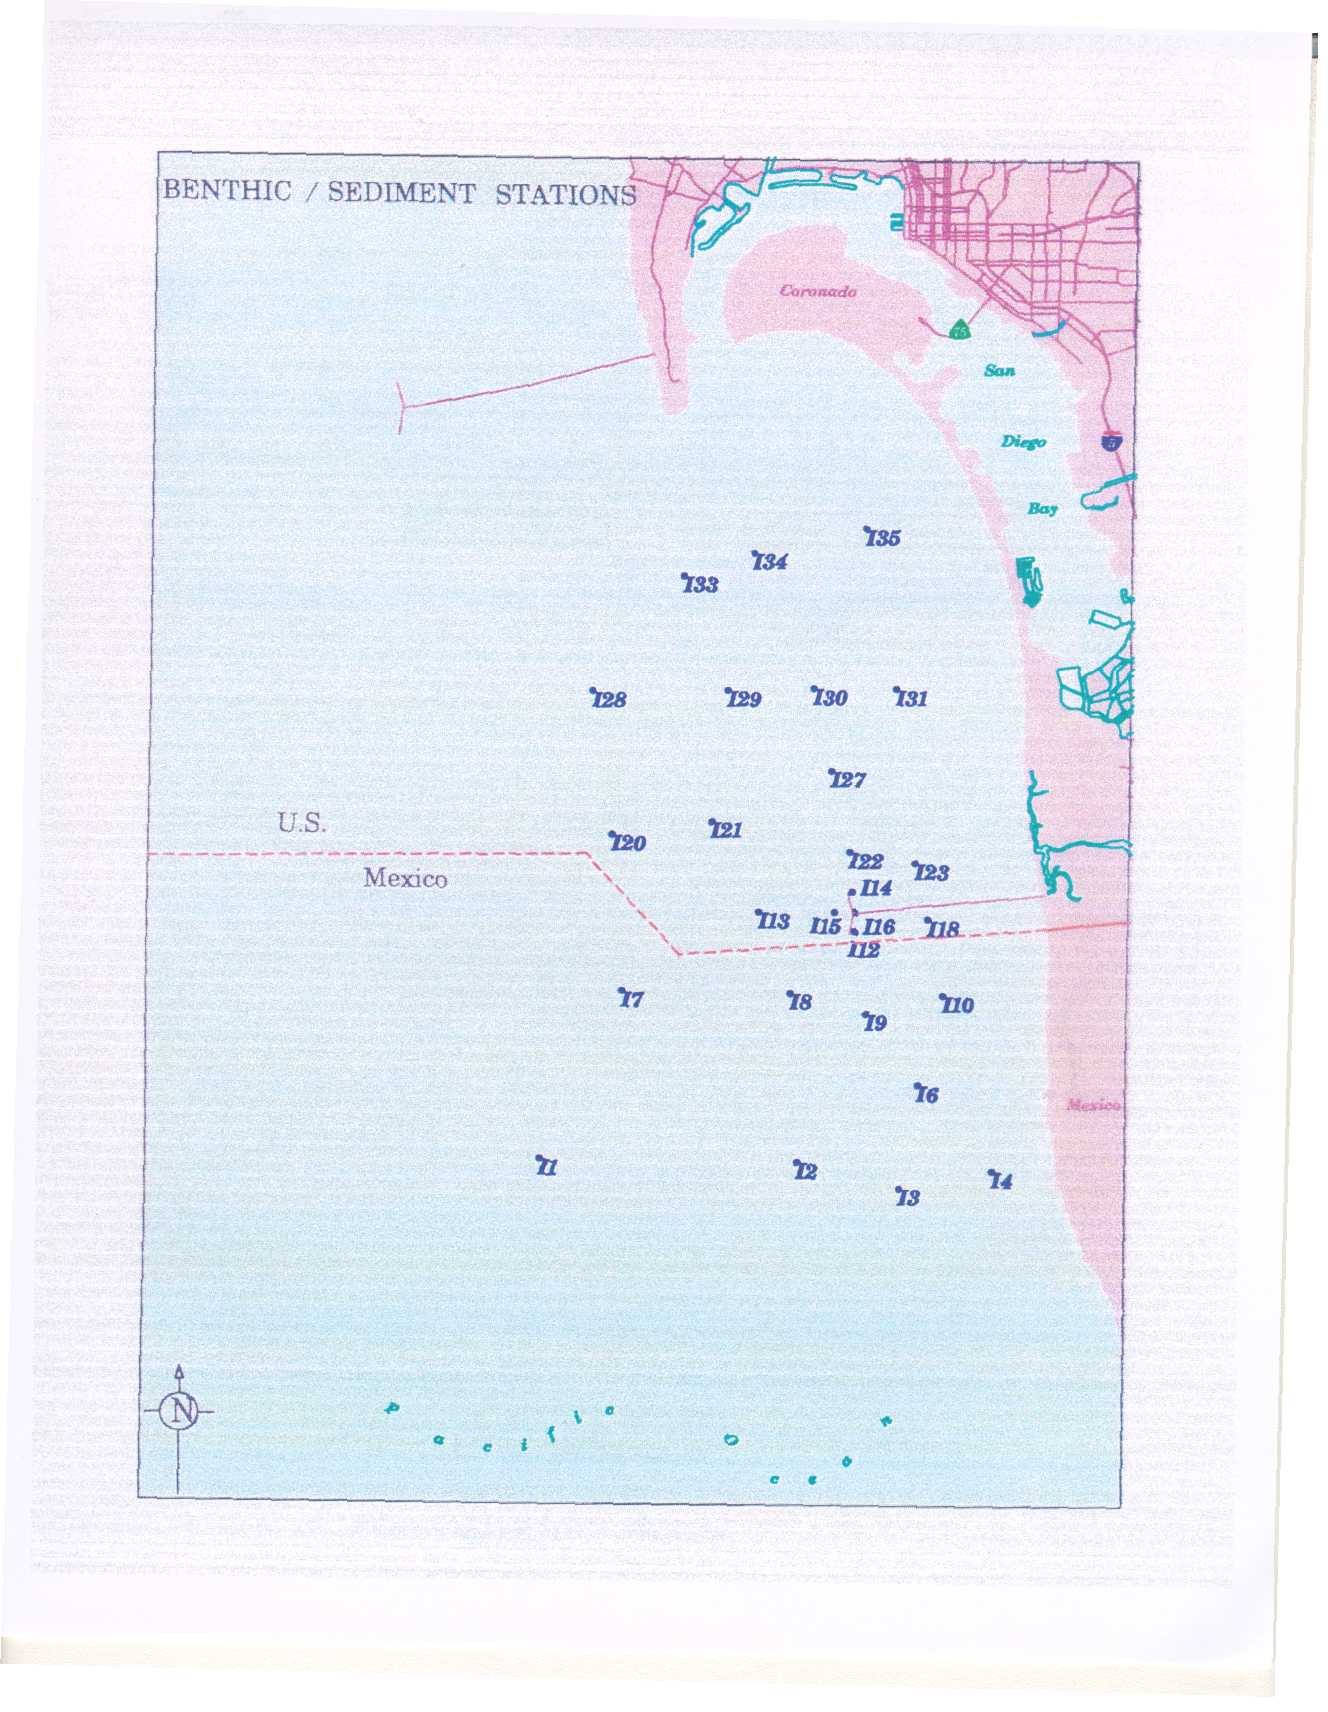
14 - Benthic/Sediment Stations (higher
resolution)
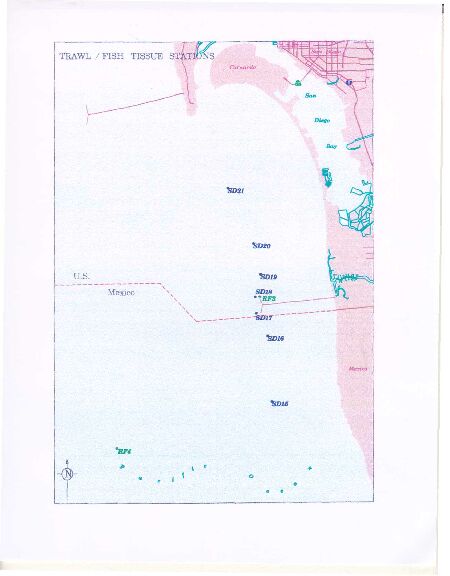
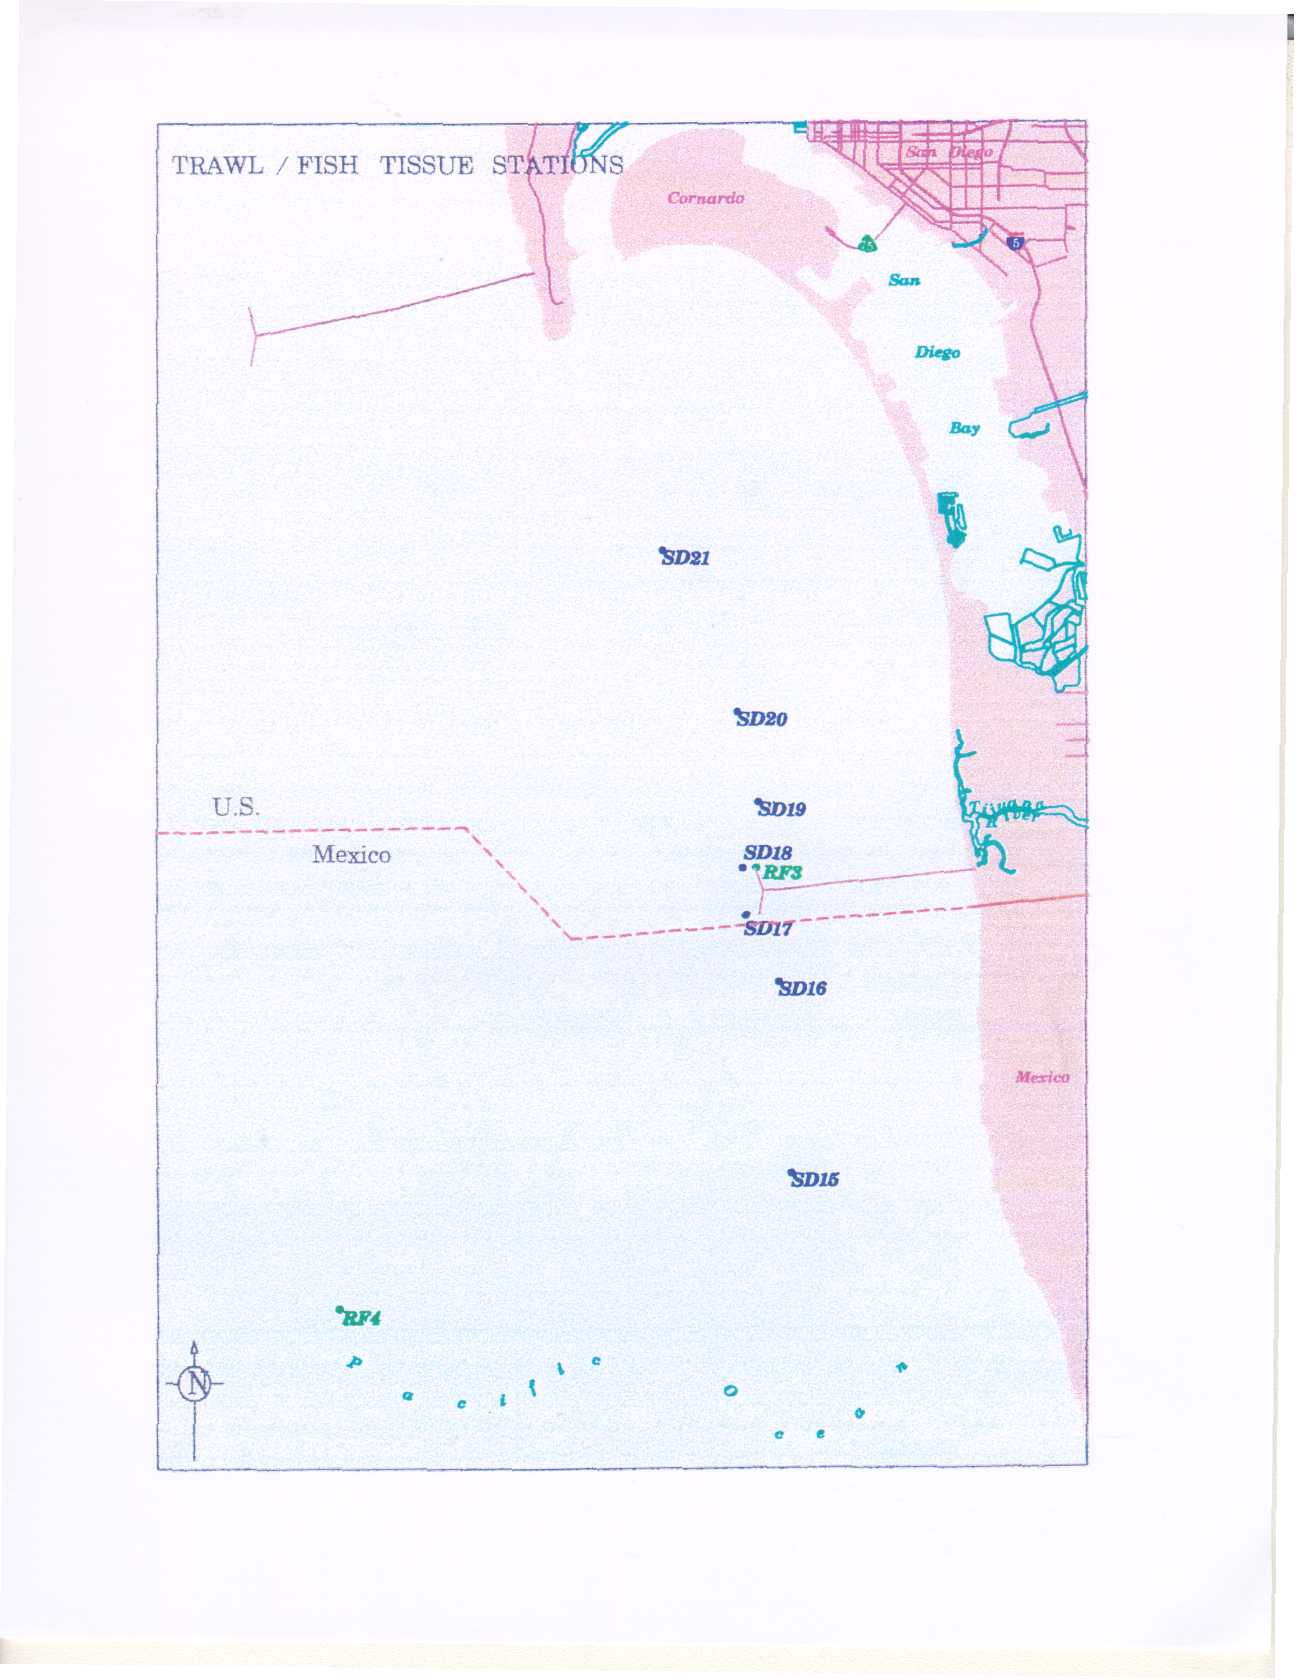
15 - Trawl/Fish Tissue Stations (higher
resolution)
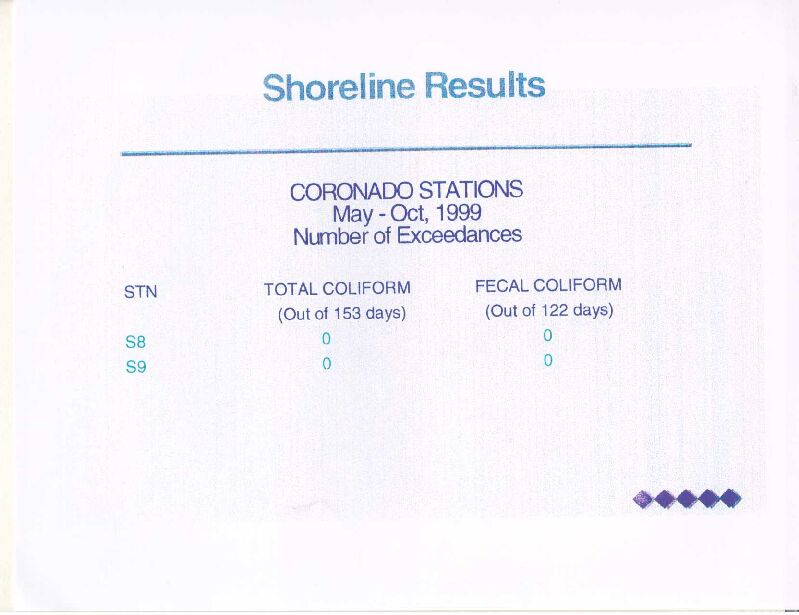
16 - Shoreline
Results Coronado Stations
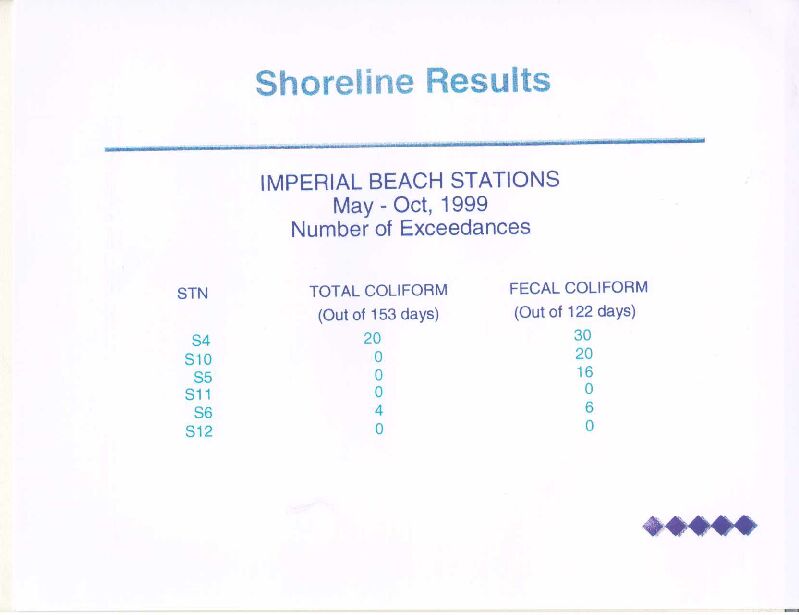
17 - Shoreline
Results Imperial Beach Stations
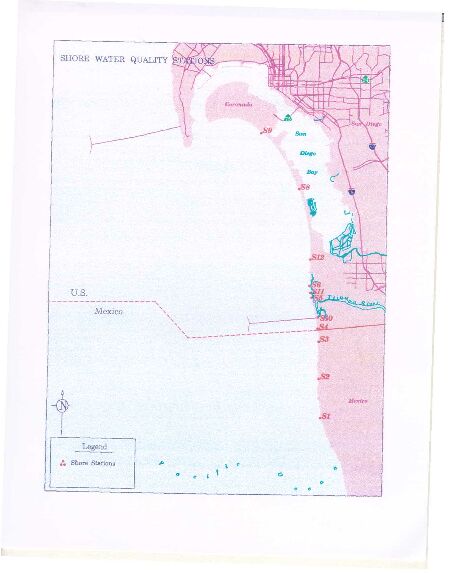
18 - Shore
Water Quality Stations (higher
resolution)
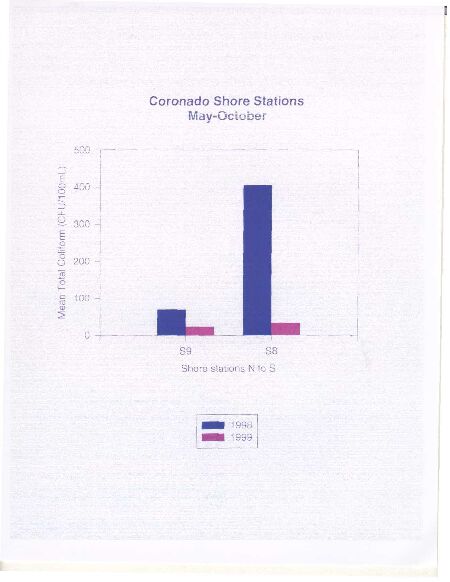
19 - Coronado
Shore Stations May-October
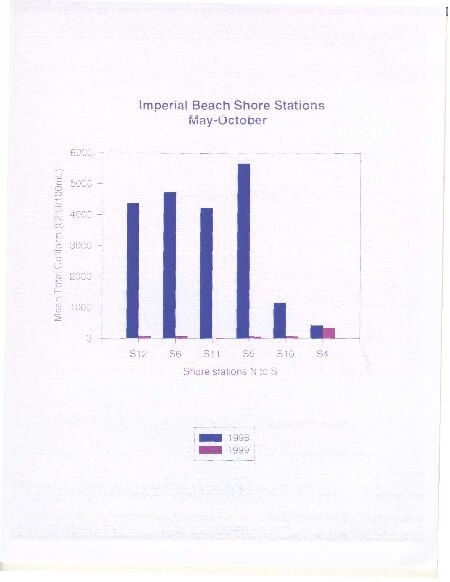
20 - Imperial
Beach Shore Stations May-October
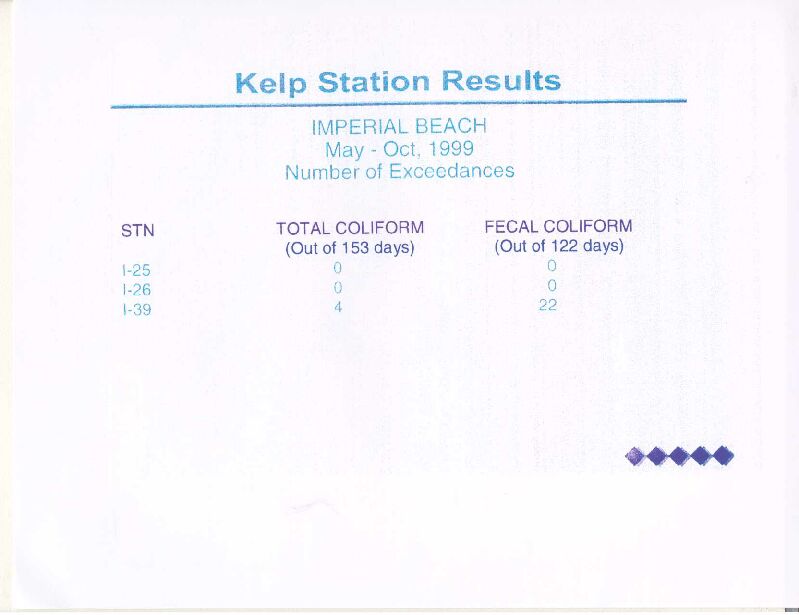
21 - Kelp
Stations Results Imperial Beach
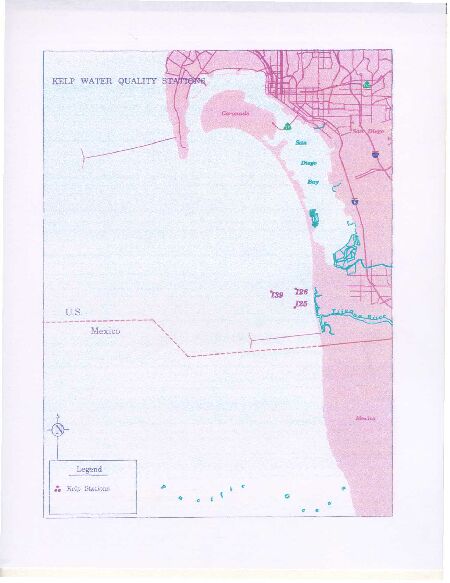
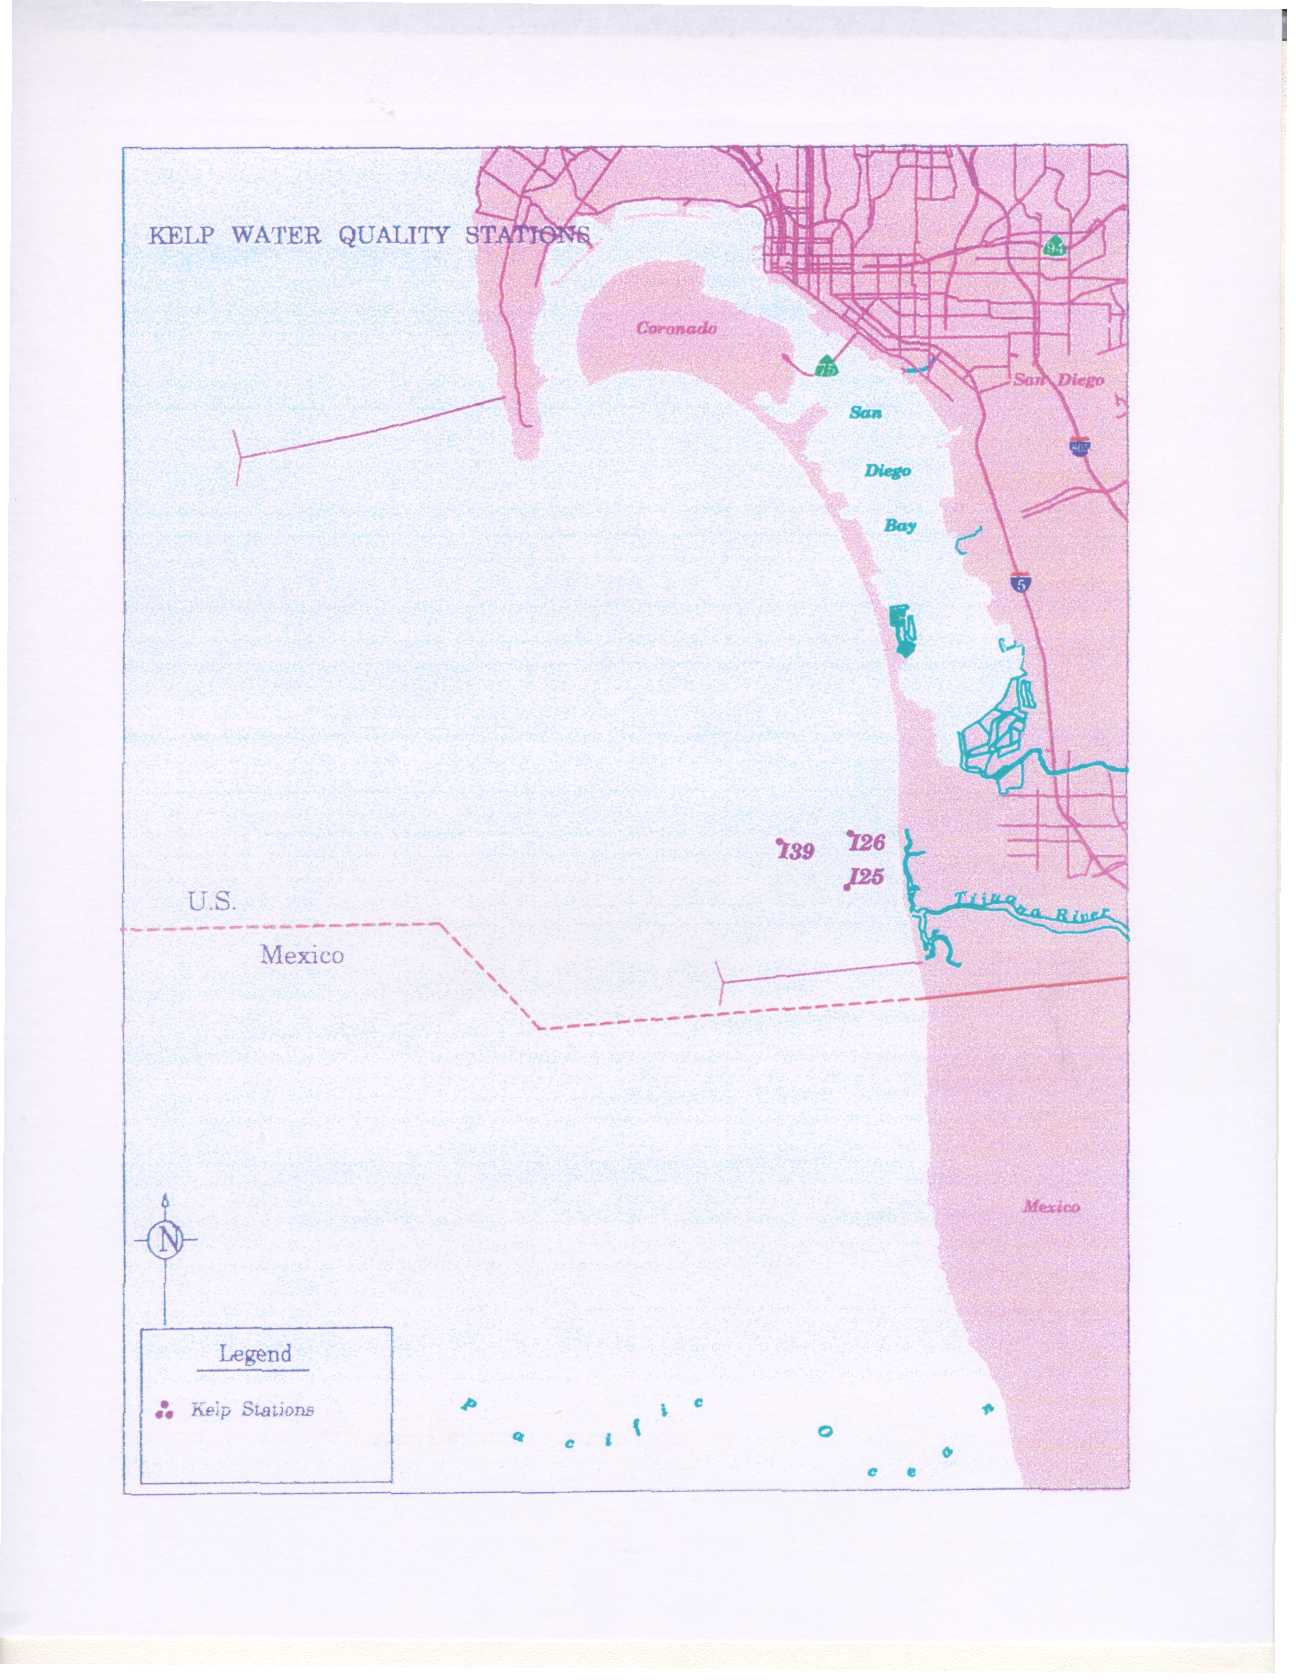
22 - Kelp
Water Quality Stations (higher resolution)
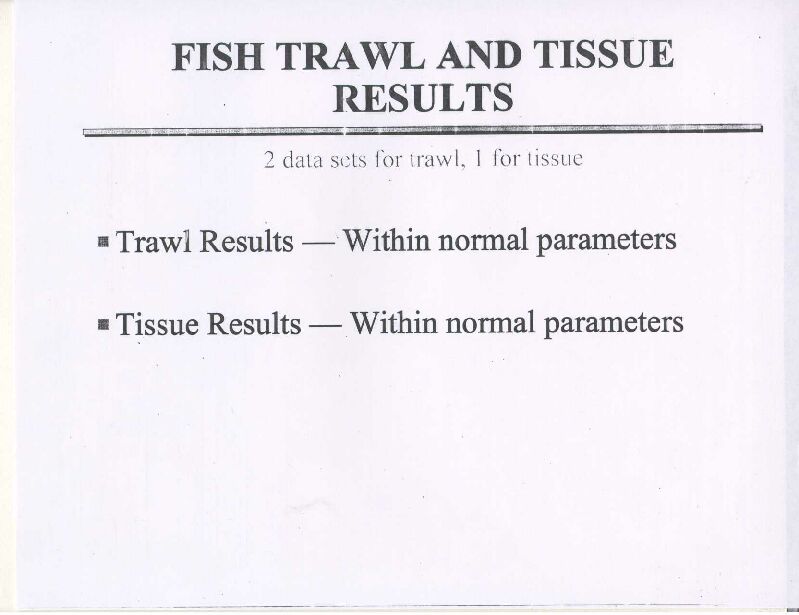
23 - Fish
Trawl and Tissue Results
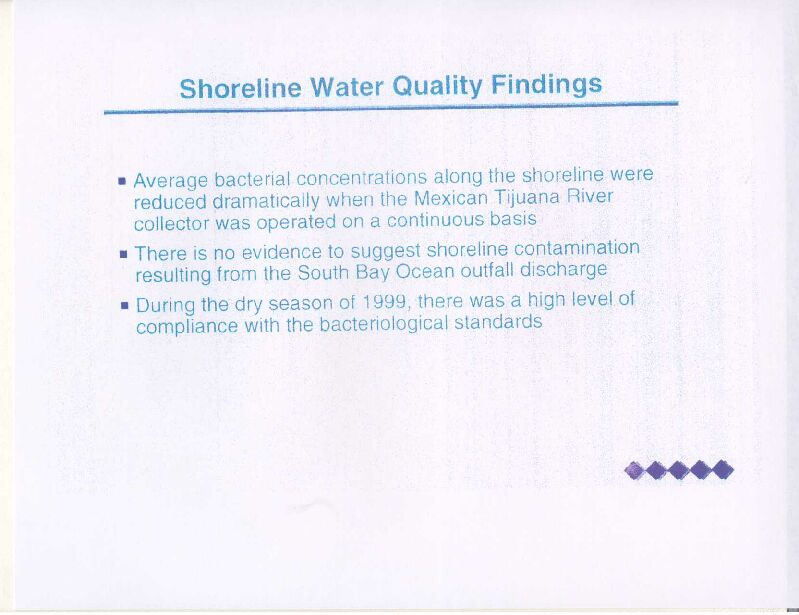
24 - Shoreline
Water Quality Findings
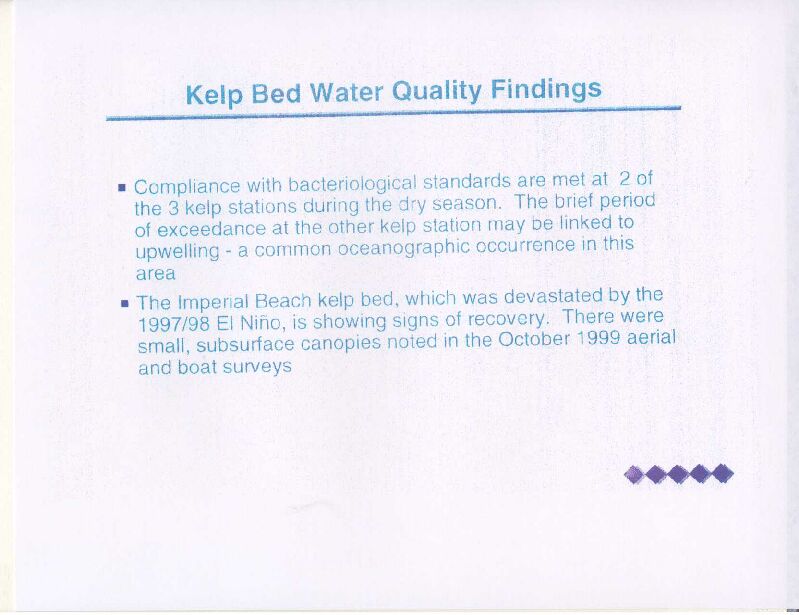
25 - Kelp
Bed Water Quality Findings
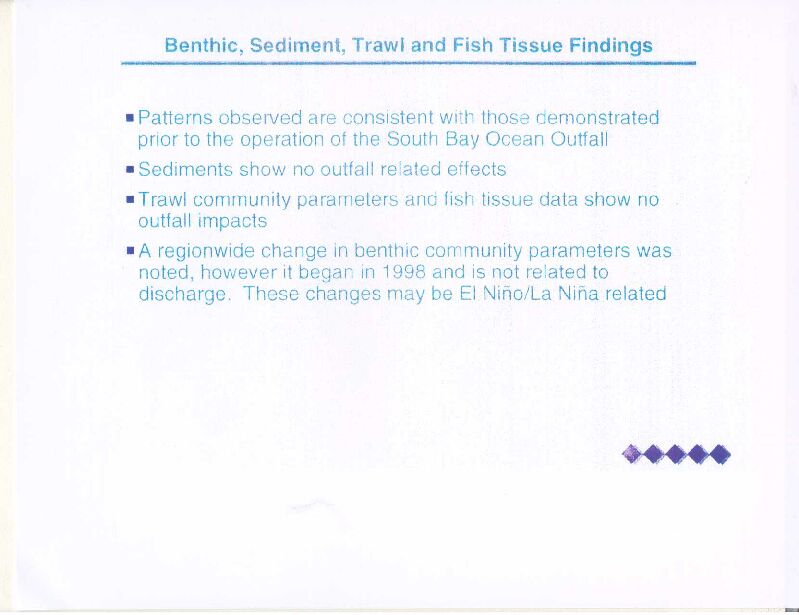
26 - Benthic,
Sediment, Trawl and Fish Tissue Findings
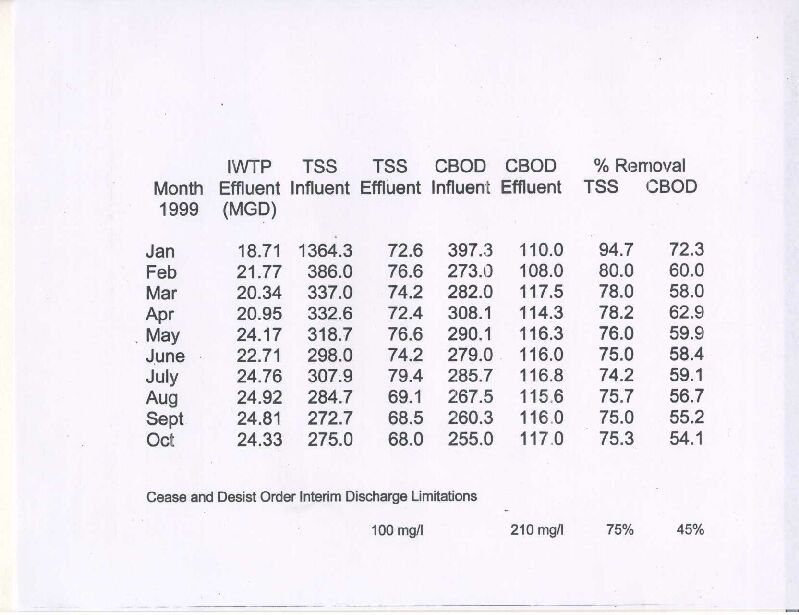
27 - Flow,
TSS, CBOD, & % Removal for Jan-Oct 1999
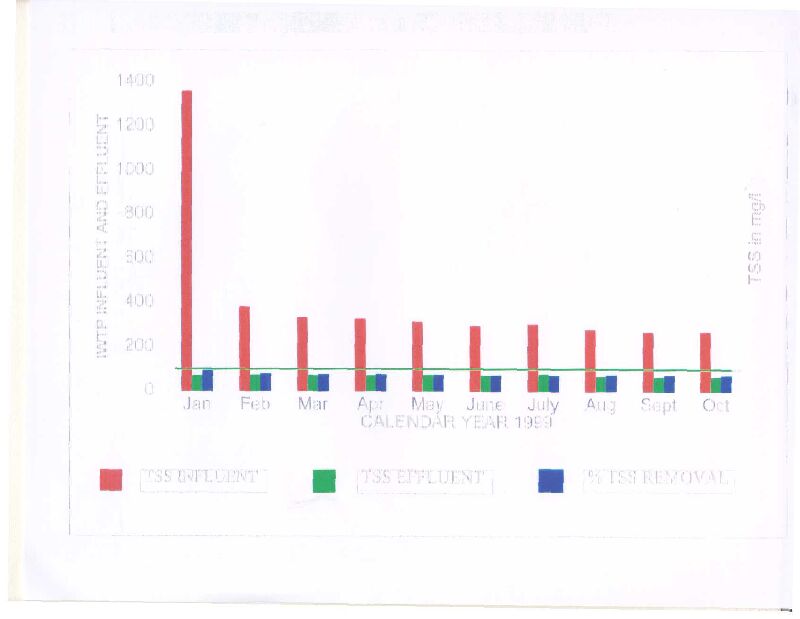
28 - TSS
Graph Jan-Oct 1999
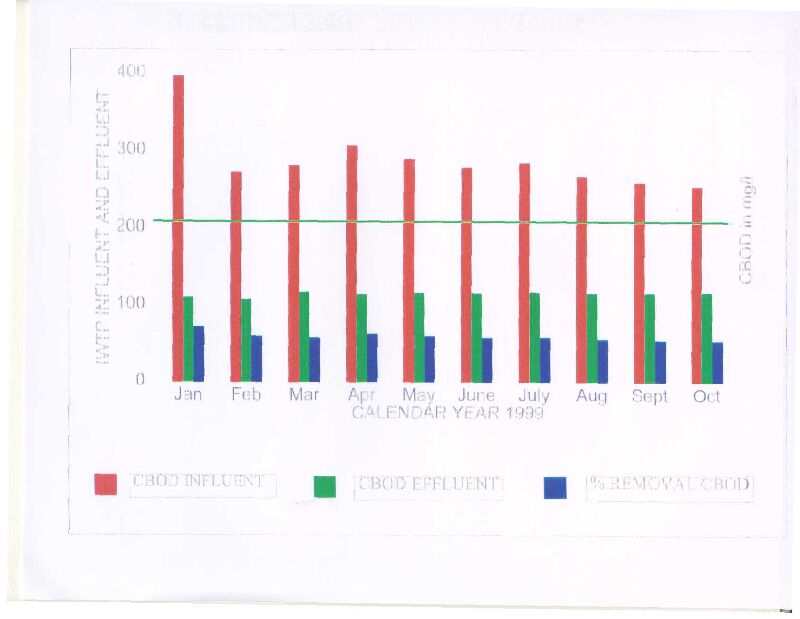
29 - CBOD
Graph Jan-Oct 1999
