

Bioassessment Scores Map
This map is outdated and does not display all available CSCI scores. A new CSCI Scores Map is currently being developed and will be available Spring 2022
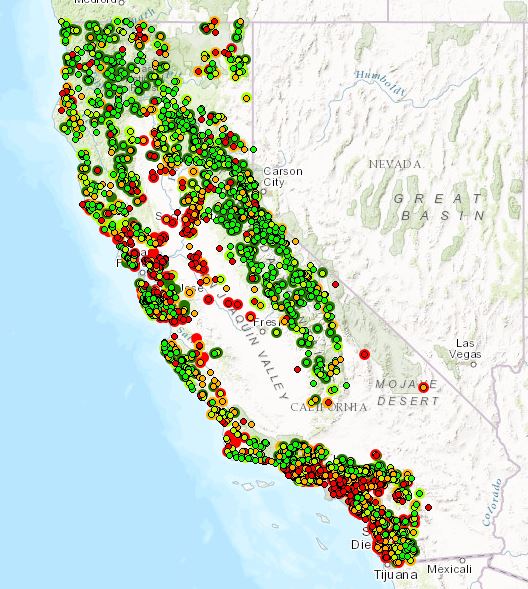
About the Map
This map displays the monitoring sites statewide that have California Stream Condition Index (CSCI) scores calculated and/or have the stream algae IBI for southern California based on diatoms and soft algae (H20) scores calculated. The sites displayed are for the most recent sample date the sample was collected. Many sites have multiple samples, but this map shows only the single sample from each site that is the most recent sample date. The CSCI is a statewide tool that translates complex data about individual benthic macroinvertebrates (BMIs) living in a stream into an overall measure of stream health. Algae serve as another indicator of stream ecological condition because they respond most directly to nutrients. The H20 is comprised of eight metrics that are based on diatoms, soft algae, and/or relative species numbers. The H20 index was developed for southern California coastal streams, so it may be inappropriate for use elsewhere in the state. This map includes probabilistic (randomly selected site that represents a known length of stream that is used to infer conditions about a large geographic region) and targeted (fixed site near location of special interest) sites. These sites come from the Perennial Streams Assessment (PSA), Reference Condition Management Program (RCMP), Southern Stormwater Monitoring Coalition (SMC), US Forest Service, and Regional Board bioassessment monitoring programs. The sites displayed were sampled from 1999 through 2015 for CSCI scores and from 2008 through 2015 for H20 scores.
Reference:
"The California Stream Condition Index (CSCI): A New Statewide Biological Scoring Tool for Assessing the Health of Freshwater Streams SWAMP Technical Memo"; by Andrew C. Rehn, Raphael D. Mazor, Peter R. Ode
"Fetscher, A.E., R. Stancheva, J.P. Kociolek, R.G. Sheath, E.D. Stein, R.D. Mazor, P.R Ode, and L.B. Busse. 2014. Development and comparison of stream indices of biotic integrity using diatoms vs. non-diatom algae vs. a combination. Journal of Applied Phycology 26:433-450."
Download Data
Excel file - This table contains the sites that have CSCI scores and/or H20 scores that populates the Bioassessment Scores Map. It contains information for station code, stream names, sample dates, county, field replicate, reference status, latitude/longitude, photo of sampling site (if available), Regional Board, CSCI score, H20 score, general chemistry, total nitrogen, total phosphorus, and physical habitat metrics.
