

Data Tool Kit - Data Management Handbook
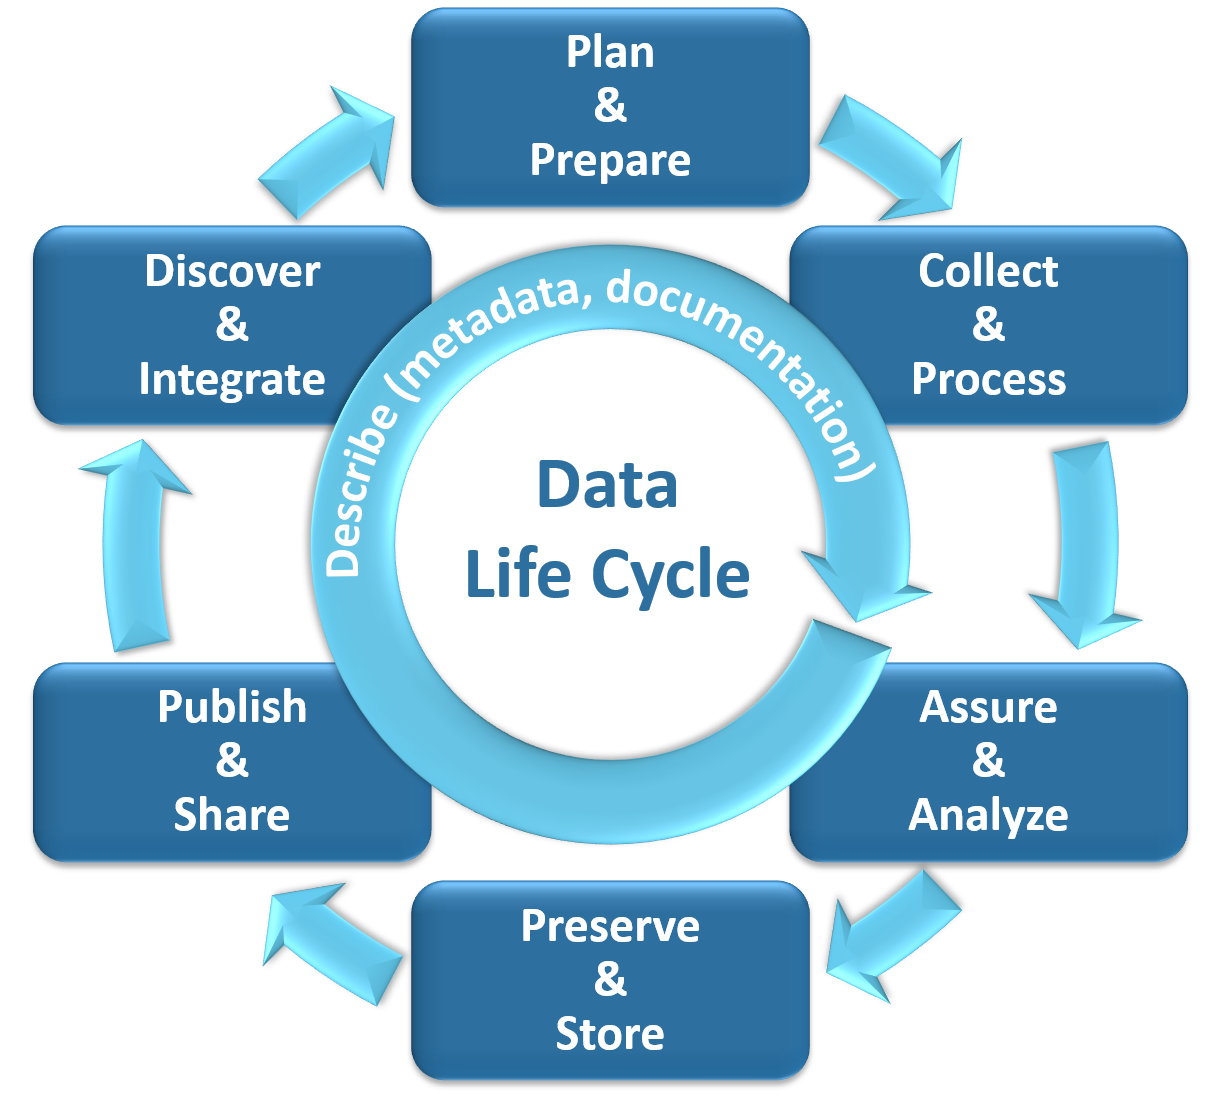
The first step in good data management practices is understanding and considering the data life cycle. The data life cycle consists of seven main phases:
- Plan and Prepare
- Collect and Process
- Assure and Analyze
- Preserve and Store
- Publish and Share
- Discover and Integrate
- Describe
Each phase is critical in collecting, managing, and maintaining high quality and useful data sets. In addition to being a cyclical process, each phase can, and at times, should be iterative.
1. Plan and Prepare
Before data collection begins, it is paramount that you think through why you want to collect the data and how you intend to use it once it is collected. This process involves:
- Defining the scope and focus of the project
- Defining the goals, objectives, and outcomes of the effort
- Take a data inventory:
- What data are already available?
- What are the data gaps?
- What data do you need to collect?
- Developing a data acquisition, monitoring, and management plan. If you are unsure where to start, try using this Water Board Data Management Plan Template!
2. Collect and Process
Next, you will need to collect and process your data. Depending on your question, data collection could involve downloading data from a repository (e.g. the California Open Data Portal or Google’s Dataset Search) or a local database and/or going out in the field and collecting the data yourself.
Good data organization and formatting is the foundation of any data project. Once the data are collected, you will need to clean them to be sure they are usable for your analyses. Expect this step to take most of your time as cleaning and formatting data tends to take 50 – 80% of your time depending on the initial state of your data.
Data can either be human readable or machine readable. Human-readable may not be readable by a computer. This could be in the form of non-digital material (e.g. printed documents or data sheets) or digital material that the computer cannot access (e.g. Portable Document Format [PDF] file, unformatted Excel spreadsheet). Whereas data are in a machine-readable format when it can be automatically read and processed by a computer (e.g. comma-separated values [CSV] file, JavaScript Object Notation [JSON] formatted file, Extensible Markup Language [XML] file) without additional scraping or transformation).
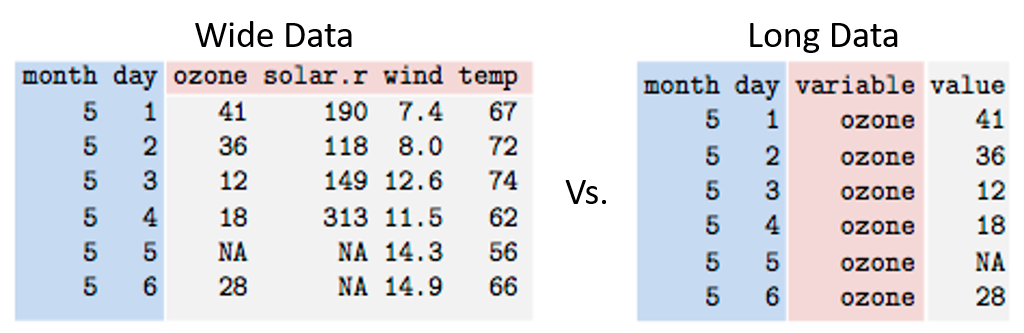
The structure of your data can either be wide or long. Most of us are used to seeing data in the wide structure because:
- It’s easier for humans to understand and process
- It’s easier to graph in Microsoft Excel
While the wide data structure may be more comfortable for us, when it comes to data analysis and visualization, long data structure is much more useful for the computer. Converting from wide to long (or vice versa) can take a lot of work, if done manually. Luckily, there are programming tools that can help make the conversion easier, such as the reshape2 package in R.
Here, we define a dataset as being the completed combination of data, metadata, and data dictionary.
At the end of the cleaning process, your data should be machine-readable and tidy. Tidy data are structured such that the data are easy to manipulate, model, and visualize. Characteristics of tidy data include 1:
- Each variable measured should be in its own column
- Each observation of your variable(s) should be in its own row
- Each value should be in its own cell
- Each dataset should be in its own table
- If you have multiple tables, they should each include a column that allows them to be linked
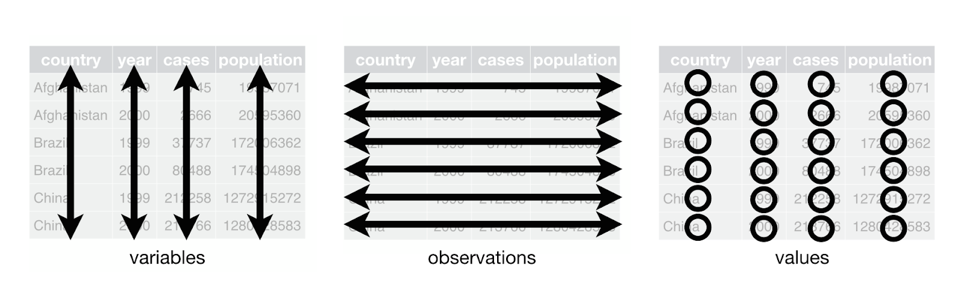
Visual representation of characteristics of tidy data. Image from Figure 12.1 of Wickham and Grolemund’s R for Data Science website.
Most of us have or use data in the form of spreadsheets (e.g. Microsoft Excel or Google Sheets) which, if used properly, can easily be saved in machine readable format (e.g. CSV). However, in many cases, the spreadsheet is structured in a way that makes this difficult:
- Metadata is included in the spreadsheet
- Pro Tip: Include this information in the spreadsheet properties or in a separate file.
- Multiple pieces of information are represented in one cell.
- Formatting is used to convey information (e.g. boldface, highlighting)
- Formatting is used to make the sheet look nice (e.g. merged cells, text boxes)
- Variable names (i.e. column names or columns headers) have spaces
- Pro Tip: Try using camel case or underscores to fix this:
- Camel Case: FileName
- Underscores: File_Name
- Pro Tip: Try using camel case or underscores to fix this:
- Not all cells have a value. Some programs interpret empty cells as NAs or 0, which can mean very different things.
- The difference between 0, null, missing, and bad data is unclear.
- Pro Tip: Know how you are going to code these types of data BEFORE it is collected, and make sure that method is used consistently throughout the dataset.
If your spreadsheet has any of the issues listed above, be sure to make corrections before proceeding to the cleaning stage. Answer and address the questions in the checklist below to clean your data. Be sure to document how you have cleaned your data and what exactly you changed. If cleaning your data manually, you will need to write each step down. If you are using R, Python or some other software to clean your data, be sure to save your code in a plain text file, which is usually referred to as a "script".
Data Cleaning Checklist
- Save a copy of the dataset and conduct your cleaning in the copy. As a general rule, you will want to leave your raw data raw and make revisions to it in a different file.
- Check for overall plausibility and errors. Do the data look right? Are there typos?
- Identify the data type of your variables (e.g. numeric, factor, string)
- Identify your missing data.
- How much data are missing?
- In what form are the missing data (e.g. Not Available [NA], NULL, empty strings/cells)?
- Where is the missing data?
- How will missing data be handled? Ignore? Impute? Remove?
- Identify outliers in your data
- How will outliers be handled? Ignore? Remove?
- Identify variables with strange names or values. Rename variables and correct values if appropriate.
- Correct or remove duplicate values.
- Transform or remove variables as appropriate.
- Are there text characters in an otherwise numeric column? Consider pulling them out to a comment field.
This checklist will get you started but is by no means comprehensive. Check out The Ultimate Guide to Data Cleaning and Elite Data Science’s Data Cleaning Mini-course to see other data cleaning checklists!
1 Jeff Leek, The Elements of Data Analytic Style, Leanpub, 2015-03-02
3. Assure and Analyze
During this phase, you will implement your quality assurance and quality control procedures and conduct your analyses.
A precursor to data analysis involves the preliminary exploration of the data. The purpose of the data exploration process is to “get a feel” for your data. Answer and address the questions in the checklist below to explore your data.
Data Exploration Checklist
- What is the metadata associated with your dataset?
- How is the data structured? How many rows (observation) and columns (variable) does it have?
- What are the types of columns included in the data?
- Run some descriptive statistics on the data (e.g. max, min, mean, median values). What are the basic trends? How are variables correlated?
- Produce simple visualizations of the data (e.g. scatter plots, bar plots, histograms). For each visualization you create, make a note of the question that motivated it and what you learned from it.
- Do you notice anything odd? Are there unexplained outliers? Do things generally look as you would expect?
If you go through the exploration process and find issues in your data, be sure to address and fix those issues before moving forward.
Note: The data cleaning and exploration steps can (and should) be iterative!
4. Preserve and Store
The preservation of the data ensures the long-term viability, utility, and accessibility of the data. This phase usually involves internal archiving or disposition of data as necessary.
5. Publish and Share
Publishing and sharing data is critical for collaboration and transparency of the data. Your project should be in alignment with the Water Board’s Open Data Resolution: “Adopting Principles of Open Data as a Core Value and Directing Programs and Activities to Implement Strategic Actions to Improve Data Accessibility and Associated Innovation.” This means:
- Documenting your process throughout the project so as to make it open, transparent, and reproducible
- Utilizing open data and open source software (e.g. Python, R) as much as possible
- Making the data you use and code you develop transparent and accessible to the public after the project is complete, as appropriate
See the Open Data Handbook for more guidance on making your data open and accessible!
This phase also includes the more traditional publication and sharing of your analytical results. This could be done internally or externally and will involve written and/or oral methods. See the Healthy Watershed Partnership’s Communicate Results Page for guidance.
6. Discover and Integrate
As you complete the first 5 phases of the data life cycle, you may discover new things about your data. Here, you take those discoveries and integrate them into future planning and management decisions.
7. Describe
This is arguably the most important phase of the data life cycle, so much so that it occurs concurrent to the other six phases. Describing your data through its metadata and data dictionaries substantially increases the usability of the data internally and externally.
Metadata are data about your data. Generally speaking, metadata can include:
- Who collected these data?
- What is the data about? What is it measuring?
- When was it collected? Over what time period?
- Where was the data collected?
- How was the data collected (i.e. what methods were used to collect the data)?
- Why these data? What is the purpose of these data?
- Data dictionary (see below)
A data dictionary is a collection of descriptive names, definitions or descriptions, attributes (e.g. data type, units), and allowable values about each element or variable in the data. Just like a regular dictionary, a data dictionary is where users of the data go to understand the meaning, interpretation and context of each data element. Data dictionaries are critical to:
- Define elements and conventions in the data
- Avoid inconsistencies among data elements
- Make data easier to use, analyze and interpret
Guidance on Metadata
- USGS Metadata Resource
- Project Open Data (used by data.ca.gov)
- FGDC metadata standard (used by CNRA)
- Content Standard for Digital Geospatial Metadata (CSDGM) (used by CNRA)
- The Dublin Core Metadata Initiative’s Metadata Basics and Metadata Element Set
Guidance on Data Dictionaries
