

Data Tool Kit - People's Data Science Handbook
If you are new to the data scene, it can be overwhelming to know where to start. Here we explain some foundational data concepts. If you do encounter jargon or terminology with which you aren’t familiar, please see the Glossary for definitions.
What are Data?
Data are a set of values representing a specific measurement or observation and can be in a number of different formats or structures, such as lists or tables. By themselves, data have no meaning. It is only through analysis and interpretation that data obtains meaning and becomes information. Analysis and interpretation can take the form of numerical summaries (think statistical analyses) or graphical representations or summaries of the data themselves (think graphs or charts). For those philosophers among us, this hierarchy continues to include knowledge and wisdom, where an accumulation and synthesis of multiple sources of information combined with experience eventually results in knowledge. Finally, when knowledge is given context, value or judgment, and shared understanding, it becomes wisdom
In addition to the data itself, working with data or a data project may require the development of a data workflow, data model, or data schema. Understanding the differences between these tools, how they are related, and how to use them will be tremendously helpful when trying to articulate general and detailed information about your data project.
A data workflow is a conceptual roadmap of your data project. Similar to a traditional workflow diagram, your data workflow should have explicit representation of how data flows through people and process. Ideally, your workflow would also include a timeline component that shows when decisions are made and how those decisions impact data flow.
A data model (AKA Entity Relationship Diagram or ERD) is a graphical representation of the data system design. The data model should generally answer the questions:
- Which data objects (e.g. databases, tables, etc.) will be used?
- Which data objects will be managed?
- Which data objects will be exported?
- How are the data objects related?
- What data products will be developed (e.g. visualization, website, application, etc.)?
A data schema shows what the “guts” of your database will look like, including the identification of tables, columns, data types, constraints, and relationships.
The table below compares the levels of detail and components included in data workflows, data models, and data schemas.
| Term | Level of Detail | Key Components |
|---|---|---|
| Data Workflow | Low – Medium | Data objects Data Flow Critical people & process Critical Timelines (as appropriate) |
| Data Model | Low – Medium | Data objects High level relationships Products |
| Data Schema | High | Data objects Tables Columns Data types Constraints Relationships |
Data Science 101
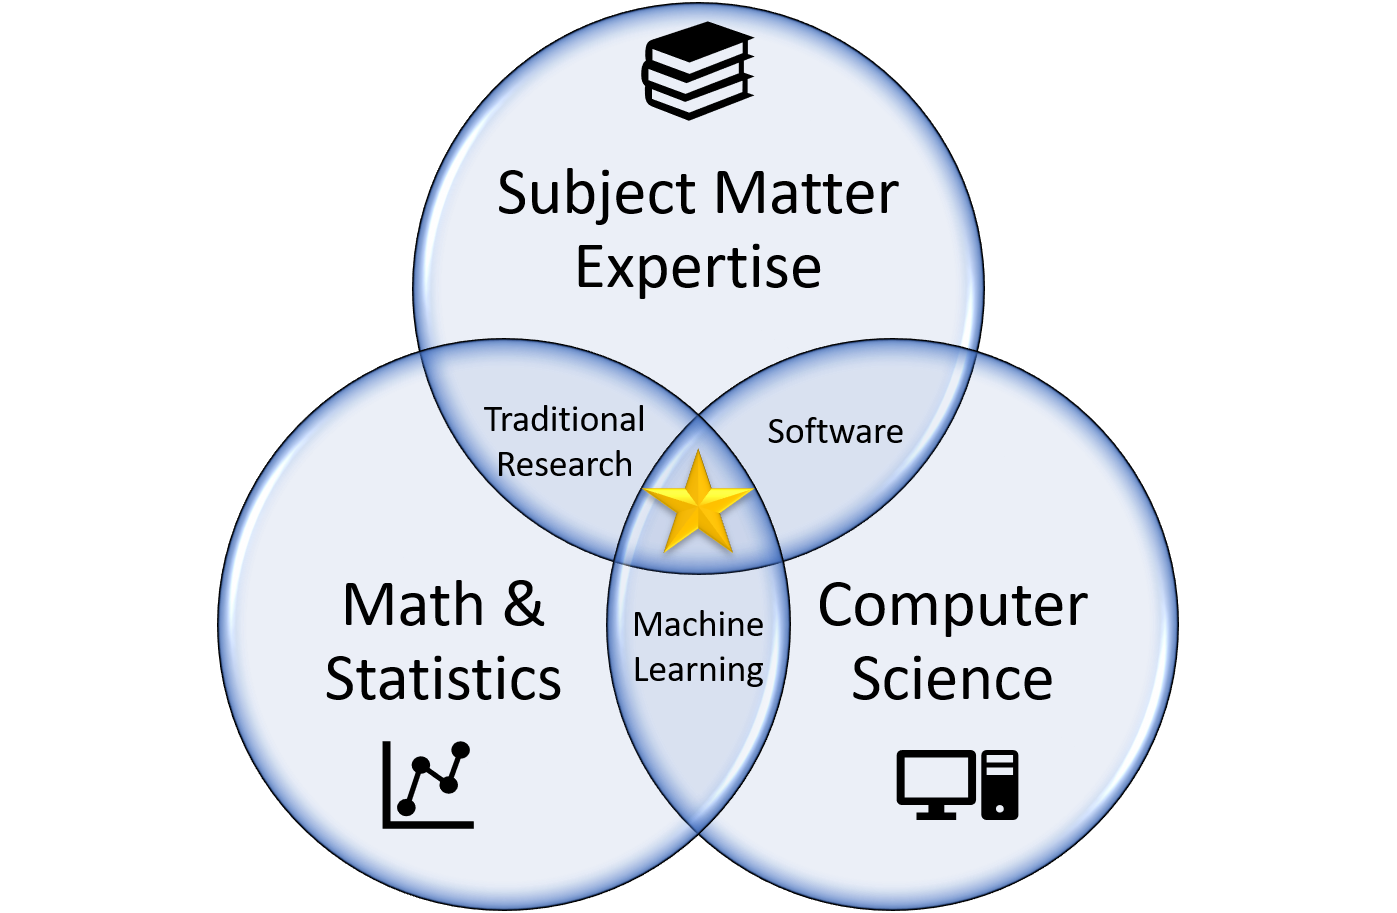
Data science, in the most simple and general sense, is the process of utilizing the scientific method to data to transform data into information and insights. Data science has been (and continues to) evolve into a multi-disciplinary field that combines subject matter expertise (e.g. hydrology, ecology, social science), computer science (e.g. software, programming, machine learning) and mathematics and statistics (e.g. models, algorithms) to identify patterns and make predictions from data. From an analytics perspective, data science can provide solutions via:
- Descriptive Analytics: transforms data into useful information to understand what happened in the past (see the Business Intelligence Handbook for more information)
- Diagnostic Analytics: utilizes data to understand why things in the past happened
- Predictive Analytics: utilizes data and machine learning techniques to classify or predict what is most likely to happen in the future (see the Machine Learning Handbook for more information)
- Prescriptive Analytics: utilizes data to recommend actions one can take to affect outcomes, which can then inform decision making
The marriage of data and data science allows us to better transform data into and communicate information. This communication can be through reports, statistical inference, making predictions, or data visualization. Using data science to develop such products can increase their efficiency, effectiveness, and transparency.
