
SWAMP Achievements Report - Assessments
SWAMP Achevements Quick Links
2015
Statewide Efforts
- SWAMP Freshwater Harmful Algal Bloom (FHAB) Program - SWAMP's new FHAB program is part of a statewide initiative to address cyanobacteria blooms and cyanotoxins in our lakes and streams. A statewide assessment and support strategy for the new program was developed in 2015 and finalized January, 2016. Work has begun on guidance documents for laboratory and field methodologies, quality assurance, and mitigation and remediation methods. A web development project is underway for web based satellite imagery analysis, mapping, notification, incident reporting, and outreach. A series of workshops are being implemented. State and regional SWAMP staff presented the program through a poster presentation at the National Harmful Algal Bloom Symposium in Long Beach. This program will help ensure that the public is protected and informed.
- CSCI Fact Sheet and Technical Memo - The California Stream Condition Index (CSCI) is a biological index used to assess the health of perennial wadeable rivers and streams. Finalized in 2015, the CSCI is the first index to provide a consistent statewide standard for interpreting bioassessment data and is the basis of the new statewide Biological Integrity Assessment Implementation Plan. It combines two unique types of indices that have traditionally been used separately: an observed-to-expected (O/E) index and a multimetric index (MMI). The Fact Sheet provides a general overview of the CSCI and the Technical Memo, written for a technical audience. This Fact Sheet summarizes the development, features and use of the CSCI.
- Interim Instructions for Calculating CSCI Scores using GIS and R - This document describes steps in calculating the California Stream Condition Index (CSCI), a bioassessment index that measures stream health based on benthic macroinvertebrate data. The instructions provided herein are provided as interim support for analyses requiring CSCI scores. The State Water Resources Control Board is currently developing a more automated approach to score calculation. Until that time, this document describes the only way to obtain CSCI scores. The first CSCI workshop was held in September 2015 to train Water Board staff on calculating scores using the interim instructions document.
- New Publication from the Stream Pollution Trends (SPoT) Monitoring Program - A publication in the international scientific journal Environmental Pollution presented the statewide trends assessed by SPoT using the initial five years of data. The paper is titled "Temporal and spatial trends in sediment contaminants associated with toxicity in California watersheds". A main focus of the paper is the increasing trend in detections and concentrations of pyrethroid pesticides statewide. There was a significant relationship between pyrethroid pesticides and urban land use, and sediment toxicity was significantly associated with these parameters. The paper can be accessed online at Science Direct.
- PSA Management Memo - The Perennial Streams Assessment (PSA) is an ongoing, long-term statewide survey of the ecological condition of wadeable perennial streams and rivers throughout California. The PSA is funded by SWAMP and other partners, including the USEPA. The PSA collects samples for biological indicators (BMIs and algae) and chemical constituents (nutrients, major ions, etc.), and also conducts habitat assessments for both in-stream and riparian corridor conditions. The memo describes the biological condition of streams in California based on a next-generation indicator of stream health applied to a robust 13-year data set.
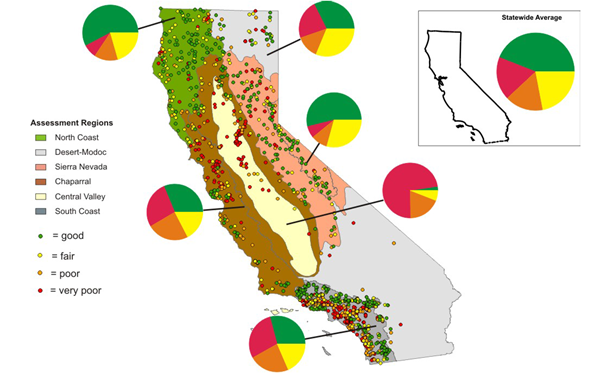
Map of 1,318 probability sites sampled by the PSA program in 2000-2012. Sampling sites are color-coded by biological condition according to CSCI score. Pie charts show percent of stream length in each of 4 condition categories by PSA region.
Regional Efforts
- Assessing the Effects of Nutrients on Phytoplankton in Suisun Bay (San Francisco Bay Region) - In 2011 and 2012 the San Francisco Bay regional SWAMP funded a study to assess nutrients and phytoplankton growth in Suisun Bay. A considerable decline in phytoplankton had been observed in Suisun Bay since the 1980s. The question was whether different nutrient forms, invasive clams, other factors, or a combination of these factors were causing the decline. Researchers at Romberg Tiburon Center (RTC) were hired to perform this study. The study grew into a collaborative effort to assess the effects of nutrients on phytoplankton in Suisun Bay. Staff from the San Francisco Bay and Central Valley Regional Water Boards, Bay Area Clean Water Agency (BACWA), Central Contra Costa Sanitary District, Delta Diablo, City of Benicia, State and Federal Contractor Water Agencies (SFCWA), the San Francisco Estuary Institute (SFEI), and regional scientists participated in this Suisun Bay Workgroup. In April 2015, a paper was published by RTC scientists that described the results of the study. The paper describes a model to predict phytoplankton blooms in Suisun Bay based on nutrient type and concentration, and river flow.
- Caffeine in Surface Waters of the San Diego Region (San Diego Region) - Caffeine is considered non-toxic at typical ambient concentrations, but it may co-occur with deleterious organic compounds, thus serving as a tracer for determining where untreated wastewater is entering aquatic ecosystems. Region 9 conducted a study to: 1) determine caffeine presence at various surface-water sites; and 2) evaluate if concentration differences are associated with different site types. Caffeine was detected year-round and was present at 58% of sites (N=85) and in 56% of samples (N=94). Detections occurred in all but one major hydrologic unit, and in every sample collected from sites known to receive wastewater containing untreated human waste at the international border. Results suggest that caffeine sources in developed catchments include leaky sewer lines, poorly maintained septic systems, food waste/beverage containers, and runoff from over-irrigation with recycled water. Conversely, in open-space areas, sources are likely linked to recreational uses, which was somewhat surprising, considering caffeine’s short half-life and high biodegradability. For more information, please see Busse and Nagoda (2015).
- Piloting a Riparian Assessment Protocol (Central Coast Region) - The Central Coast Ambient Monitoring Program partnered with the Central Coast Wetlands Group (CCWG) to apply to the AmeriCorps program for a Watershed Stewardship Team. The team is working out of the CCWG Moss Landing office and is piloting an assessment approach for linear characterization of riparian stream habitat. This approach will be used along with satellite imagery to map riparian habitat quality in the Central Coast Region.
- Flow Assessment Project (Central Coast Region) - Central Coast Ambient Monitoring Program staff have partnered with flow specialists from the California Department of Fish and Wildlife to develop recommended flow minima for several Central Coast streams. This effort uses field-measured flow and channel morphology, along with gaged flow, to develop flow minima to support various stream functions. Initial field data have been collected, and flow and stage data from adjacent gaging stations have been compiled for use in the model.
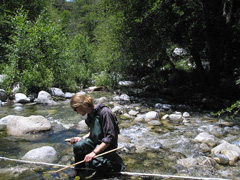
- Wadeable Streams as Widespread Sources of Benthic Cyanotoxins in California (San Diego Region) Cyanobacteria are photosynthetic organisms that sometimes produce toxins ("cyanotoxins") injurious to humans and animals. Toxic cyanobacterial blooms have been increasing in lentic water bodies and large rivers due to anthropogenic factors. While cyanotoxin surveys have traditionally focused on lentic water-column samples, recent SWAMP monitoring has indicated that cyanobacteria are common in wadeable stream benthos (bottoms), and the toxin microcystin has been detected in 1/3 of the stream segments assessed. Cyanotoxins can exert downstream impacts on ecosystem services, as illustrated recently by Miller et al. in Monterey Bay, where inland-derived microcystins were linked to sea otter mortalities. Results of the present study provide strong evidence that wadeable streams throughout the state could be significant cyanotoxin sources. This finding has implications for the management of drinking water, wildlife, and recreational resources, within both the streams themselves and in receiving waters, including the ocean. For more information, please see Fetscher et al., 2015.
- Pharmaceuticals and Personal Care Products in the San Diego Region (San Diego Region) - Contaminants of emerging concern (CECs) are relatively unmonitored/unregulated chemicals occurring at trace levels in wastewater discharges, ambient receiving waters, and drinking water. They include pharmaceuticals and personal care products (PPCPs), and may adversely affect human/environmental health. Region 9 conducted a study to: 1) determine PPCP presence, patterns, and potential sources; 2) evaluate whether PPCPs may be impacting human health and/or the environment; and 3) provide recommendations for future monitoring. Results showed a relatively broad presence of PPCPs at low concentrations (i.e., none exceeding water-quality benchmarks) in San Diego streams, with PPCP extent and magnitude more significant in winter than in summer. PPCPs were also detected in wastewater-treatment-plant effluents in a pattern suggesting that more advanced treatment levels correspond to fewer kinds/lower concentrations of PPCPs in effluent. Results of this and other CEC studies in Southern California have been combined to put forth a strategy for the future CEC monitoring in the San Diego Region.
 Click to enlarge
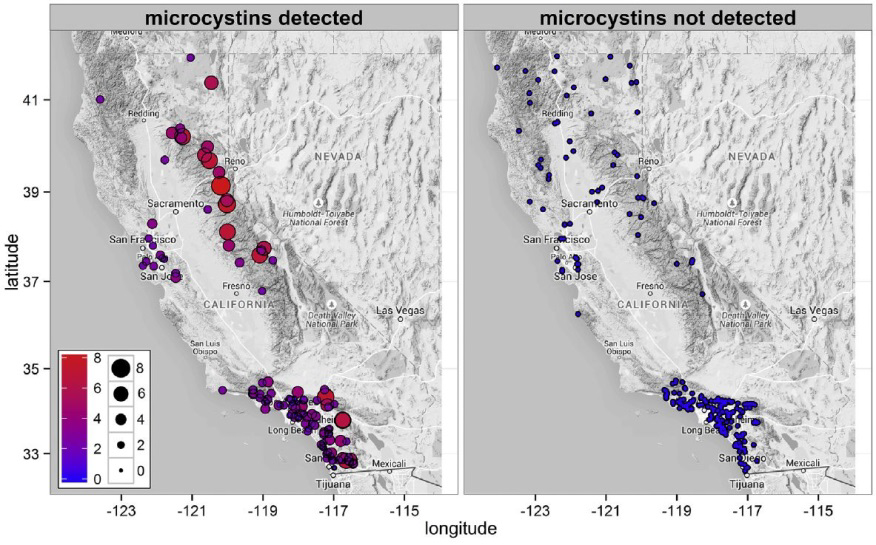
Wadeable stream sites where benthic microcystin concentrations were assessed. Left panel shows all sites where microcystins were detected; icon size and shading indicate relative concentrations (mg m-2) on a natural-log scale, with larger/red corresponding to higher values (see legend). Right panel shows all sites where microcystins were tested for, but not detected.
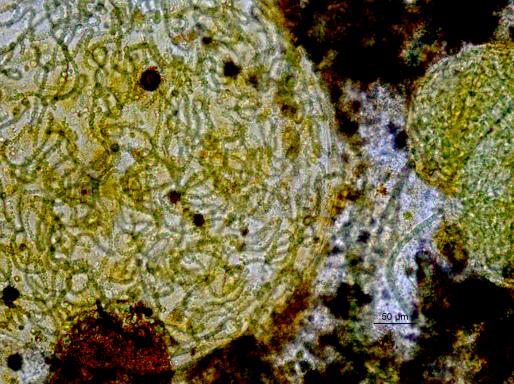
Photomicrograph of Nostoc, a candidate microcystin producer in the benthos of California wadeable streams. This genus can fix nitrogen and is commonly found in oligotrophic streams subjected to minimal human disturbance. Photo credit: Betty Fetscher
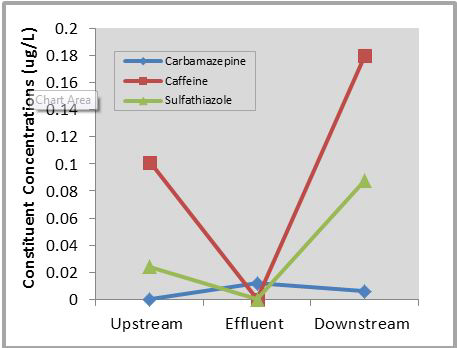
PPCPs at Padre Dam Wastewater Treatment Plant (WWTP) Sites, March 2010. Different concentrations of 3 PPCP constituents were found depending upon locations of sampling sites above and below the WWTP, and within the effluent. Note that caffeine has been removed by treatment, but concentrations are high again below the WWTP, suggesting other pathways of entry of this compound into the receiving water.
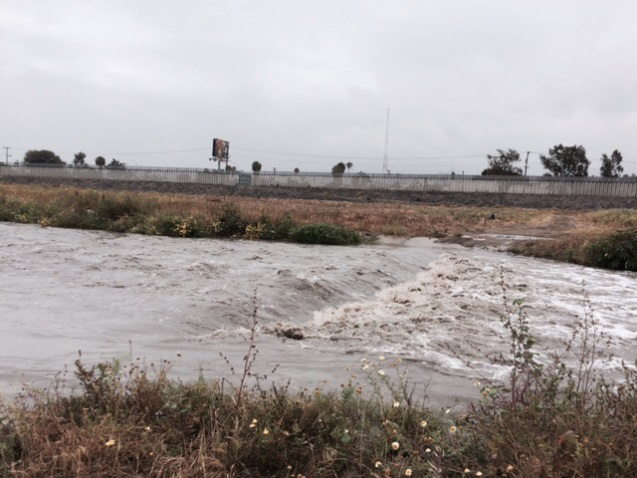
Cross-border (US/Mexico) flows of the Tijuana River transport trash and PPCP compounds, including caffeine, to the Tijuana River Valley (the Valley) on the US side in rain events (as well as during dry-weather over-flow events). Additionally, urban development areas surrounding the Valley on the US side contribute trash, as well as caffeine, to the Valley. Photo credit: Xueyuan Yu
2014
Statewide Efforts
- Perennial Streams Assessment (PSA) 13-year report – The PSA 13-year report is the latest installment in statewide condition assessments and the first to use the California Stream Condition Index (CSCI). The report summarizes and updates major survey findings from the first 13 years of the program (2000-2012). The report addresses 4 major questions: 1) What is the biological condition of California streams? 2) Is stream condition changing over time? 3) What is the relative condition of streams draining agricultural, urban, and forested landscapes? 4) Which chemical and physical stressors have the strongest association with biological condition?
Objective answers to these questions provide a comprehensive interpretive context for all water quality programs in the state, and thus serve as a vital foundation for consistent statewide bio-objectives, development of nutrient criteria directly tied to aquatic life uses, support of long-term climate change monitoring, evaluation of the success of stream restorations, and prioritization of the healthiest streams and rivers to protect for future generations.
- Reference Condition Monitoring Program (RCMP) – Forty sites were sampled by RCMP in 2014. Most were revisits to sites that had not been sampled in over 10 years. The goal of site revisits is to quantify long-term trends in statewide reference conditions, especially in the context of drought and climate change. In addition, data loggers that measure water depth were deployed at 11 sites to allow us to quantify the relationship between biological assemblages and continuous flow variables (e.g., the magnitude and duration of flood events and the duration of stream drying during drought conditions), something previously possible only if sampling occurred near stream gages. Continuous flow data will allow much more accurate assessment of the potential effects of low flows and stream drying as California enters its fourth year of drought.
- CSCI Scoring Automation - The first steps were taken towards full automation of the CSCI scoring tool for general use by multiple agencies and the public. The models and algorithms for scoring biological condition at sampling sites were written into a downloadable package that functions in the open-source statistical program R. The ultimate goal and next step is to provide a web-based interface so that users can provide geographic coordinates for each sampling site in conjunction with benthic macroinvertebrate data and get an automated output of CSCI scores.
Regional Efforts
- CCAMP Data Navigator Public Release (Central Coast Region) – The Central Coast Ambient Monitoring Program (CCAMP) Data Navigator is a web-based viewing tool for staff, policy makers, and the general public to use for viewing graphs, charts, data sets, and indices. In 2014, the website was enhanced with more documentation, additional statistical tools, access to thresholds, and threshold references.
- Central Coast Healthy Watersheds Methods Paper (Central Coast Region) – CCAMP finalized a paper describing the technical basis for the scoring used in the CCAMP website. It helps simplify complex data so it is more accessible to the user.
- Central Valley Safe to Swim Study (Central Valley Region) – This study is focused on monitoring and managing fecal pollution in popular swimming areas in the Central Valley. Results from the study will be used by the Central Valley Water Board to identify watersheds impacted by fecal pollution, prioritize future microbial source tracking efforts, and determine additional monitoring needs.
- San Diego River Watershed Monitoring and Assessment Program and Watershed Report Cards (San Diego Region) – In 2014, the workgroup completed a technical report describing the design of the San Diego River Monitoring and Assessment Program and draft report cards. The workgroup also created the Watershed Science Institute at the San Diego State University.
- Causal Assessment in the San Diego Creek Watershed (Santa Ana Region) – In December 2014, the San Diego Creek Causal Assessment project was formally introduced at a workshop held at the Southern California Coastal Water Research Project's (SCCWRP) offices. Several bioassessments have been conducted on San Diego Creek as part of the Southern California Stormwater Monitoring Coalition's project and Region 8's own multi-year bioassessment monitoring. Indices of biotic integrity consistently score in the very poor to poor category of biological health. This project will utilize the causal assessment process to determine the stressor(s) leading to the degraded biology. Additionally, this project will build local capacity in performing causal assessments and will utilize a new approach to selecting comparator sites that potentially could streamline causal assessments in California.
2013
Statewide Efforts
- The California Stream Condition Index (CSCI) – SWAMP's new CSCI was finalized in 2013 and represents the next generation of biological indicator for assessing stream health throughout the state. Unlike previous indices that were applicable only on a regional basis, the CSCI was built with a statewide dataset of nearly 2,000 sites that represents the broad range of environmental conditions across California. The CSCI provides consistency and accuracy in the interpretation of biological data collected by both statewide and regional monitoring programs and is the basis of the new statewide Biological Integrity Policy.
- Condition of California Perennial Wadeable Streams Based on Algal Indicators – A statewide report using data on algae species composition and algal biomass to evaluate the condition of California’s wadeable perennial streams.
- New Indices of Biotic Integrity for Southern California Streams Based on Algae – SWAMP contributed to the development of new algae-based indices of biological integrity that will be used for assessing stream health in southern California. Future studies will be conducted to determine whether these indices can be adapted for use in other parts of the state.
Regional Efforts
- Healthy Watersheds Project Website (Central Coast Region) – The Central Coast Region is developing a new website for the Healthy Watersheds Project that will host the project's site-specific report cards and water quality data.
- A Regional Survey of the Extent and Magnitude of Eutrophication in Estuaries in Southern California (San Diego Region) – The San Diego Region completed a study designed to characterize the extent and magnitude of eutrophication in coastal estuaries of southern California.
- Causal Assessment in the San Diego River (San Diego Region) – A causal assessment was conducted to investigate the five candidate causes potentially responsible for biological impairment in the San Diego River.
2012
Statewide Efforts
- Reference Condition Monitoring Program (RCMP) – SWAMP's RCMP is a statewide network of nearly 600 reference sites. These reference sites set a benchmark for expected ecological conditions in healthy streams and rivers where human disturbance to the environment is absent or minimal. RCMP provides context for interpreting data, setting objective regulatory thresholds, and identifying streams and watersheds deserving of special protections and application of anti-degradation policies. In 2012, 39 reference sites were sampled. The success of the program led to the development of a new statewide biological indicator called the California Stream Condition Index (CSCI).
- Monitoring Stream Health in the Sierra Nevada National Forests – SWAMP and the U.S. Forest Service (USFS) partnered on a report about stream quality in Sierra Nevada national forests. A total of 74 total sites sampled by USFS and the Management Indicator Species (MIS) Program from 2000 to 2010 were also combined for a more robust assessment of regional stream condition. Sampling of 41 new sites by the MIS program, in addition to regional Perennial Streams Assessment sampling, will continue in 2013 and 2014.
- Survey of Contaminants in Sport Fish on the California Coast – SWAMP released findings from the state's largest-ever survey of contaminants in sport fish in coastal waters. The survey, which was conducted in 2009-2010, analyzed 46 fish species from 68 locations for multiple contaminants, including methylmercury and PCBs.
Regional Efforts
- Healthy Watersheds Project (Central Coast Region) – The Central Coast Region is developing a system of color-coded report cards that will be used to score the health of watersheds in the region. This effort is closely coordinated with the development of watershed report cards in the San Diego region.
- Bacteria Monitoring in Eastern Sierra Nevada (Lahontan Region) – In March of 2012, the Lahontan Region completed a summary report on bacteria in streams of the eastern Sierra. The report presents findings of indicator bacteria sampling at 37 streams throughout the eastern Sierra. Monitoring and report writing for this effort were supported by SWAMP funds.
- Santa Ana Regional Assessment and Monitoring Program (Santa Ana Region) – The Santa Ana Regional Water Board initiated development of a program designed to guide the Region's monitoring and assessment activities. The program will also oversee that data generated from these activities are coordinated and consistent.
- Development of Report Cards in the San Diego Region for Watershed Health (San Diego Region) – The San Diego Region is developing a report card system that will be used to assess the health of watersheds in the region. This project is closely coordinated with the Central Coast Healthy Watersheds Project (see above).
- Southern California Freshwater Depressional Wetlands (Los Angeles, Santa Ana, and San Diego Regions) – Completed the first year of a study designed to identify the condition of freshwater depressional wetlands in southern California and the major stressors affecting depressional wetland condition.
2011
Statewide Efforts
- The 8-Year Perennial Streams Assessment (PSA) Report – The PSA report is the compilation of data collected from several programs over an eight year period from 2000-2007, and focuses on the ecological condition of the State’s perennial streams.
- Reference Condition Monitoring Program (RCMP) – SWAMP’s RCMP has implemented a strategy to target and sample the highest quality (healthy) streams in California. These streams serve as a foundation for developing statewide biological objectives, and for establishing a framework to identify and protect healthy watersheds.
Regional Efforts
- Central Coast Assessment of Agriculture Impacts Report (Central Coast Region) – The Central Coast Ambient Monitoring Program released a report which assesses water quality in agricultural areas of the Central Coast Region.
- Bacteria Source Identification in the Central Valley (Central Valley Region) – A Central Valley Region study which investigates bacterial occurrence in public waters and determines its potential sources.
- Sediment TIE (Toxicity Identification Evaluation) (Central Valley Region) – This Central Valley based study was designed to improve procedures for extracting and recovering two pesticides of concern (chlorpyrifos and bifenthrin) from sediment interstitial water.
- Safe to Swim Report and Fact Sheet (Central Valley Region) – A final report and fact sheet for Safe to Swim monitoring conducted in June 2009.
- Grasslands Bypass Project (Central Valley Region) – SWAMP contributed to the report and published a fact sheet for the Grasslands Bypass program.
- Postfire Report (San Diego Region) – This study was designed to look at post-fire conditions in Southern California water bodies. Study Goals were to determine how wildfires impact biological conditions in streams, look at recovery times and how they differ between developed and undeveloped watersheds, and to identify the primary mechanism by which wildfires affect biological conditions in streams.
- Fish Consumption Advisories (San Francisco and Lahontan Regions) – Information from SWAMP monitoring of fish tissue is used to develop Fish Consumption Advisories. The monitoring results are provided to the CalEPA’s Office of Environmental Health Hazard Assessment (OEHHA), which develops, publishes, and disseminates Safe Eating Guidelines for specific waterbodies.
- Trash Assessment in Southern California (Los Angeles, Santa Ana and San Diego Regions) – A regional pilot project trash survey conducted at sites across southern California watersheds which assesses the extent and magnitude of trash on southern California streams.
2010
Statewide Efforts
- Statewide Assessment of Toxicity in California Waters
Published report summarizing nine years of sediment and water toxicity test results from California watersheds and coastal waters. - Areas of Special Biological Significance (ASBS) Ambient Water Quality Studies (Coastal)
- Contaminants in Fish from California Lakes and Reservoirs 2-yr Study: Technical Report on Two Years of Screening Surveys. This is a Bioaccumulation Monitoring Program study.
- Published the Two-Year Lakes Study (2007, 2008): Frequently Asked Questions Fact Sheet (See Two-Year Lakes Report under the Assessment Tab).
- Developed automated processing tools to assess all SWAMP data for inclusion in future integrated 303d/305b reports. Over 10,000 lines of evidence (LOEs) were created by this system in 2009 to support the listing process.
- Published SWAMP Assessment Framework, (SWAMP Strategy, Appendix C)
The Assessment Framework is a guidance document that will be used to assist other Water Board programs in designing monitoring programs that answer their management questions. The objective is to get data from other programs to be comparable with SWAMP. - Updated the My Water Quality Safe to Eat Portal. SWAMP is the lead agency for the Bioaccumulation Workgroup which reports to the California Water Quality Monitoring Council.
Regional Efforts
- SWAMP Publishes: An Approach to Interpreting Narrative Objectives for Biostimulatory Substances along the Central Coast (Central Coast Region)
- San Joaquin River Basin Rotational Sub-basin Monitoring: Eastside Basin Report (Central Valley Region)
- San Joaquin River Basin Rotational Sub-basin Monitoring Project: Westside Basin Report (Central Valley Region)
- Published Urban and Agricultural Sources Study of Pyrethroid Insecticides to the Sacramento-San Joaquin Delta (Central Valley Region)
- Published a report on Water Quality Monitoring and Bioassessments in San Francisco Bay Region Watersheds at Select Reference Sites, 2007 – 2010
2009
- Published US EPA’s review of the State’s Bioassessment Program (Evaluation of the California State Water Resources Control Board’s Bioassessment Program)
- Published plan for developing and maintaining reference conditions for interpreting bioassessment data in California’s wadeable streams (Recommendations for the Development and Maintenance of a Reference Condition Management Program to Support Biological Assessment of California’s Wadeable Streams)
- Published report on contaminants in sportfish from California lakes and reservoirs (Contaminants in Fish from California Lakes and Reservoirs: Technical Report on Year One of a Two-Year Screening Survey)
- Published Safe to Swim Fact Sheets (Region 5)
- Published San Joaquin River Basin: Main Stem and Drainage Basin Sites (Region 5)
- Published San Joaquin River Basin Rotational Sub-basin Monitoring: Cosumnes, Mokelumne, and Calaveras Watershed (Region 5)
- Published Residential Runoff as a Source of Pyrethroid Pesticides to Urban Creeks (Region 5)
- Published Index of Biological Integrity (IBI) for the Eastern Sierra Nevada Ecoregion (Region 6)
- Published Wadeable Streams Bioassessment Sites Sampled (Region 8)
- Completed Eutrophication Assessment in San Diego Coastal Wetlands (Region 9)
- Began work on San Diego Regional Water Quality Data Portal (Region 9)
Questions or Comments?
- Please direct inquiries to the State Water Board, Surface Water Ambient Monitoring Program (SWAMP).
- State and Regional Board contacts listing: https://www.waterboards.ca.gov/water_issues/programs/swamp/swamp_contacts.html
