

SWAMP - Constituents of Emerging Concern (CECs) in Aquatic Ecosystems
Contaminants of Emerging Concern (CECs) Monitoring and Toxicity Testing at Hood Monitoring Station
The objective of this project was to look at a key indicator site that represents the integration of the Sacramento River watershed prior to entering the Delta. The Hood location represents downstream input from four significant areas in the Sacramento River Watershed: the Colusa Basin Drain (comprised primarily of agricultural runoff); 2) the Sacramento metropolitan area (urban storm water); 3) the Feather River (primarily agricultural influences), and 4) discharge from the Sacramento Regional Water Treatment Plant. The goal of this study was to use three categories of ecological indicators, occurrence of pollutants, sublethal and lethal toxicity to fish (Rainbow trout) and amphiploids (Hyalella Azteca) to evaluate the water quality. The high level summary of findings can be seen in this data visualization https://public.tableau.com/profile/dawit.tadesse#!/vizhome/ToxandChem/Story1.
The detail of the report is available by following the link below. The data used for analysis is available in CEDEN Database UCD AHAL Hood Full Report.
Advisory Panel on Constituents of Emerging Concern (CECs)
In April 2012, a scientific advisory panel named the “Ecosystems Panel (Panel)” provided recommendations for the monitoring of CECs in aquatic ecosystems. The recommendations are presented in a report titled, “Monitoring Strategies for Chemicals of Emerging Concern (CECs) in California’s Aquatic Ecosystems.” In the report, the Panel recommended using a risk-based screening framework to identify an initial list of CECs to monitor. The Panel also recommended implementing an adaptive phase monitoring approach to assess the presence of the CECs and their potential risk to the environment. The Panel was funded by the State Water Resources Control Board and the David and Lucile Packard Foundation. Water Board Staff has prepared a report that presents the Panel’s recommendations.
Relevant Information
- Workshop on Constituents of Emerging Concern (CECs) and Aquatic Ecosystem Monitoring – the state of knowledge and practice in CA (May 1 and 2, 2017)
- The State Water Board and Regional Water Quality Control Boards (Water Boards) have independently worked on projects to monitor and identify the CECs of highest risk to human health and the environment. oordinating the efforts will more efficiently and effectively utilize State and local resources and work towards the overarching goal of developing a statewide strategy to address CECs. The May 1 workshop shared the current state of knowledge on CECs and study efforts underway in the Bay-Delta, Los Angeles, and other areas of California. The May 2 workshop presented the most recent information regarding how to monitor and study CECs in California and the proposed monitoring designs and strategies presented by stakeholders in Region 5.
- Constituents of Emerging Concern (CECs) Presented at the State Water Resources Control Board Workshop by Regional and Statewide Programs. (February 22, 2017)
- Constituents of Emerging Concern (CEC) Pilot Study Monitoring Plan
- Monitoring of Constituents of Emerging Concern (CECs) in Aquatic Ecosystesm - Pilot Study Guidance
- Monitoring of Constituents of Emerging Concern (CECs) in Aquatic Ecosystems - QA/QC Guidance
- CEC Stakeholder (05/09/2014) and Technical Advisory (05/02/2014) Mid-term Meeting Minutes and Presentations'
- CECs Stakeholders and Technical Advisory Kick-off Meeting Presentations - 9/12/2013
- Aquatic Ecosystems Staff Report
- Monitoring Strategies for Chemicals of Emerging Concern (CECs) in California Ecosystems - Recommendations of a Scientific Advisory Panel Report
CEC Monitoring Dashboard
The CEC Dashboard summarizes data for CECs downloaded from the California Environmental Data Exchange Network (CEDEN) database from 2001 - 2022 for all matrices. The dataset originated from 32 different programs and over 60 projects. The dashboard includes an interactive map and several interactive graphics. In the map, monitoring locations are shown by circles and identified by colors if CEC is detected or not detected at specific location. The graphics show the number of samples detected and not detected by year and CEC category. The features are interactive and more information can be displayed by clicking on the circle symbols or the graphics bar.
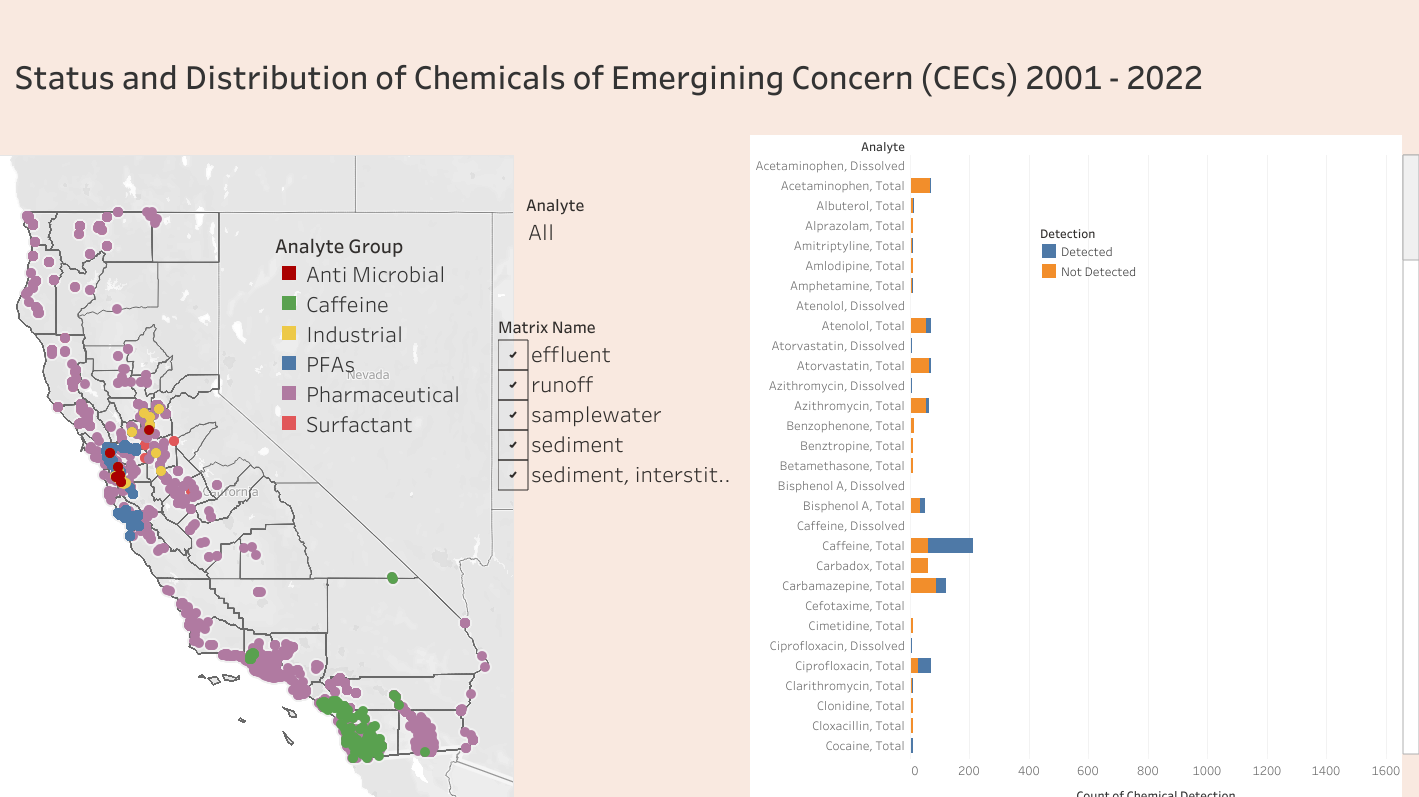
- Click on the image to open the interactive dashboard
